As of the latest release guide, I could only find this Summer ’17 guide in regards to Wave Analytics Dashboard
But it is only the documentation of how to use JSON and what kinds of parameters can be added.
I have also browsed You tube videos without any success, finding out that there wasn't any visual material for this.
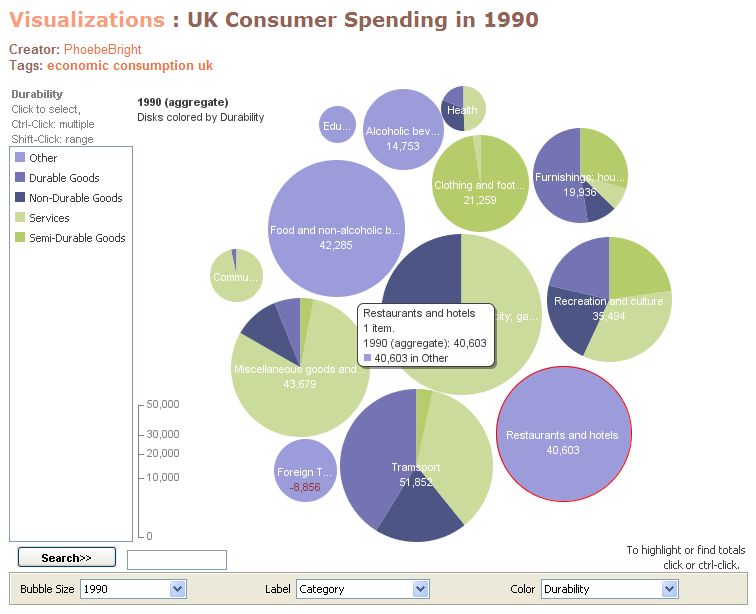
Is there a more high level guide on what level of customization JSON can achieve? For example, I know that the basic drag and drop has quite limited functionality. Wondering if JSON can scale the pie charts to any given size and be grouped together in 1 page like the image below?
Can someone with Wave Analytics Dashboard experience help to answer the question?
Thanks!

