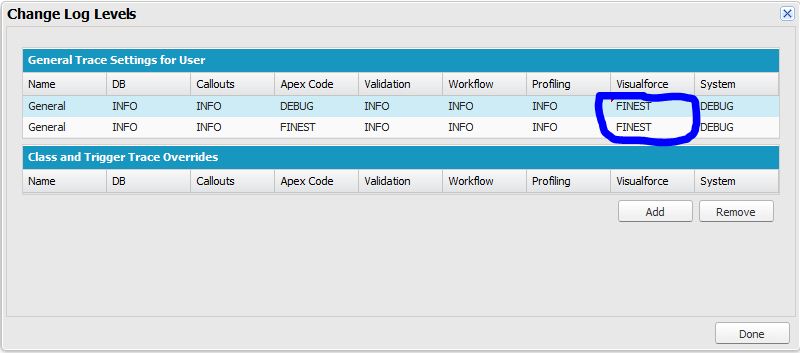
I built a visualforce page with the canvas app. The visualforce page contains only the canvas app and no other data related stuff. The canvas app is based on SAP webdynPro. I am also passing three parameters to the canvas app. After running the vf page, i checked the debug log for some kind of detailed information like,
- type of request that canvas app used.
- the parameters that is being passed to canvas app.
But the debug log looks very simple and plain just like the one given below.
29.0 APEX_CODE,DEBUG;APEX_PROFILING,INFO;CALLOUT,INFO;DB,INFO;SYSTEM,DEBUG;VALIDATION,INFO;VISUALFORCE,INFO;WORKFLOW,INFO
08:33:01.030 (30574000)|EXECUTION_STARTED
08:33:01.030 (30622000)|CODE_UNIT_STARTED|[EXTERNAL]|06690000004PcxZ|VF: /apex/sapcanvaswithinput
08:33:01.629 (87437000)|CUMULATIVE_LIMIT_USAGE
08:33:01.629|LIMIT_USAGE_FOR_NS|(default)|
  Number of SOQL queries: 0 out of 100
  Number of query rows: 0 out of 50000
  Number of SOSL queries: 0 out of 20
  Number of DML statements: 0 out of 150
  Number of DML rows: 0 out of 10000
  Maximum CPU time: 0 out of 10000
  Maximum heap size: 0 out of 6000000
  Number of callouts: 0 out of 10
  Number of Email Invocations: 0 out of 10
  Number of fields describes: 0 out of 100
  Number of record type describes: 0 out of 100
  Number of child relationships describes: 0 out of 100
  Number of picklist describes: 0 out of 100
  Number of future calls: 0 out of 10
Question:
- Is the above debug log a normal one for a canvas app or should it contains more details?
- How and where can i verified what parameters has been passed over to the canvas app?
Update:

Thanks, Baskaran
