23

I used to view % of code coverage in [Code Coverage] column for apex classes, after I run the test class.

Now the column is missing. I notice about one week ago.

How can I get it back as it is so useful and easy to check which lines are cover or not?

Even in Salesforce, they mentioned it in this link

4
  • 1
    Another problem with Run All Test is that we have many managed package in our Sandbox/Dev orgs, If I hit run all test that will be a real pain as managed package test take over 3 hours to run. Quite sad that salesforce removed a handy feature without providing a good alternative which is better or atleast does what previous functionality was doing.
    – Amit Jain
    Commented Oct 22, 2013 at 13:53
  • You can't get it back, salesforce removed it and isn't planning on returning it. Commented Oct 22, 2013 at 14:02
  • I have found through various ridiculous scenarios that if the class does not appear in the bottom right box labeled "Overall Code Coverage" it will not get the colored lines to show you which lines you do not have covered. I have to use the force.com IDE to find which lines I don't have covered when this happens and it takes almost an hour for the results to come back into eclipse and re-build the workspace.
    – Chris
    Commented Oct 31, 2013 at 16:40
  • I wanted to just put a comment but I can't. > How can I get it back as it is so useful and easy to check which lines > are cover or not? How can you check which lines are covered or not via percent of covered class? I know it's painful, but I used to open each class which I was interested into and look there for %. Commented Oct 31, 2013 at 17:29

5 Answers 5

15

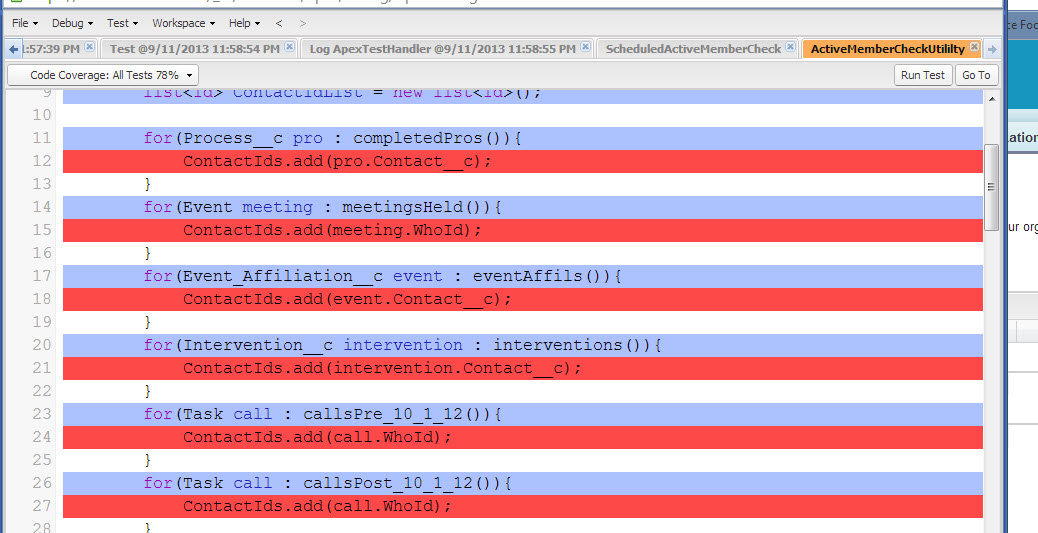
Salesforce is trying to push the use of the developer console. You can still view the color coded view of your classes to see which lines are covered or not in the developer console.

I also find this highly annoying as the old way was much more useful, but SF is really trying to push the developer console.

After running your tests, you need to select the tests you want to look at and click the 'Developer Console' button. You can then choose the test in the Class Code Coverage tab

6
  • 6
    But [Developer Console] is very slow comparing to just quick glance of [Code Coverage] column and it takes too long to load even I wants to check the code coverage lines.
    – kitokid
    Commented Sep 12, 2013 at 5:09
  • Yeah I still don't like to use this Developer Console too. But apparently it's not like we gonna have the choice anymore unfortunately.
    – brovasi
    Commented Sep 12, 2013 at 11:16
  • @kitokid, I completely agree, but unfortunately that is the direction that SF is heading. I have a feeling we will all be forced to use the developer console to some degree in the next few releases. Commented Sep 12, 2013 at 11:23
  • i am still not able to see code coverage. I see the square box in lower right corner name as "Overall code coverage" but nothing being displayed there. Commented Sep 12, 2013 at 12:42
  • Yah. I am facing the same problem as Pramod. for Some test classes, I can see the All Test % and color for lines. Most of test classes, I can only see % per method and no color even if I choose the particular % of method. Any idea to overcome?
    – kitokid
    Commented Oct 24, 2013 at 5:57
8

Yep, they decided to move it away to the Developer console. Which, of course, is incredibly annoying. Also, what I find maddening in the linked response is their explanation that it's costly to support multiple tools. Now, how costly for thousands of developers it is to be forced to use a half-bugged tool that keeps changing, that they don't mention.

EDIT: I don't know if this is known to everyone, but it wasn't to me, so I will mention it. In the developer console, you can click the Tests tab in the lower part of the window and then, on the right, there is a sortable list of classes with test coverage. As Kevin P remarked, it doesn't show all the classes, but it's better than nothing, sort of. Well, I never used developer console for this, so I was unaware of the functionality, although it seems obvious. Could be useful to others.

4

There's an unacknowledged known issue where not all classes with code coverage show up in the dev console's lower right hand box. Supposedly this is close to being fixed.

1
  • I liked the humour but not sure people would get it :)
    – Matt Lacey
    Commented Nov 5, 2013 at 23:42
2

Go in Develop->Apex Classes, click the link "Compile All Classes" and then the button "Run All Tests". Once finished, go back to the classes view and the Code Coverage column should be populated.

3
  • as there are over 400 classes and run all tests will be quite consuming. Wondering why that column disappears suddenly?
    – kitokid
    Commented Sep 12, 2013 at 3:25
  • Is that is sandbox or prod? Commented Sep 12, 2013 at 3:29
  • it is in sandbox.
    – kitokid
    Commented Sep 12, 2013 at 5:03
1
  • log in to salesforce
  • select 'Setup'
  • on the left side, select Build>Develop>Apex Classes
  • on the Apex Classes page, there should be a link that says "Estimate your organization's code coverage". Click it.
  • you should be presented with a summary of your code coverage.

code coverage

You must log in to answer this question.

Not the answer you're looking for? Browse other questions tagged .