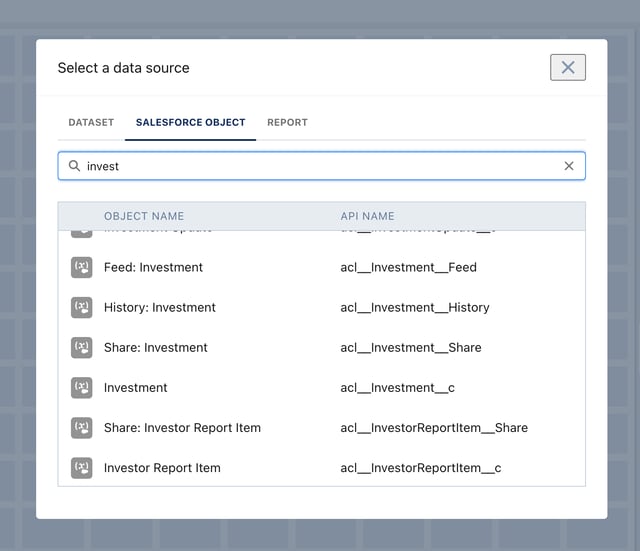
I'd like to present a some charts that reflect the latest data entered into an org using CRM Analytics. Introductory CRM Analytics documentation focusses on the use of datasets, but datasets can be refreshed at most every 15 minutes. So confusing for a user who has modified a record locally, but does not see that change in a chart for some time.
How do I handle this: how do I make this more real-time?

