0

I'd like to present a some charts that reflect the latest data entered into an org using CRM Analytics. Introductory CRM Analytics documentation focusses on the use of datasets, but datasets can be refreshed at most every 15 minutes. So confusing for a user who has modified a record locally, but does not see that change in a chart for some time.

How do I handle this: how do I make this more real-time?

1 Answer 1

1

Took me a while to find this (I wasted time on datasets) so sharing here.

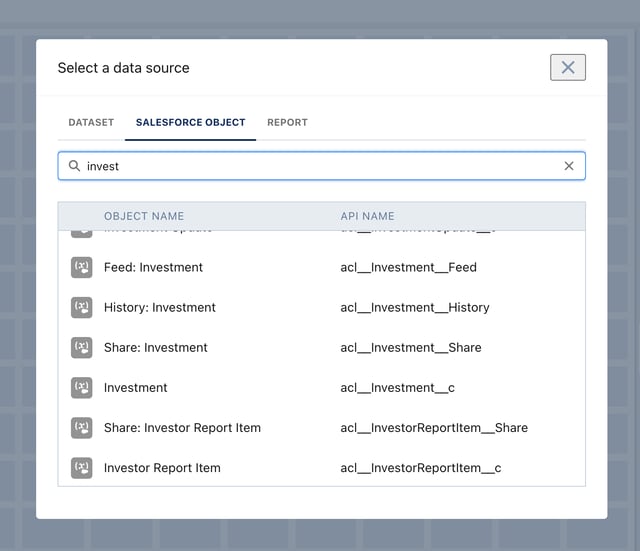
Thanks to watching this rather old video Bring Live Data Into Einstein Analytics With Salesforce Direct, the answer is to not use datasets but instead use direct queries. The tab for that is now labelled "Salesforce Object".

Seems to keep most of the functionality, including the WYSIWYG editing and interactivity, and also allows direct query editing if needed.

dialog

You must log in to answer this question.

Not the answer you're looking for? Browse other questions tagged .