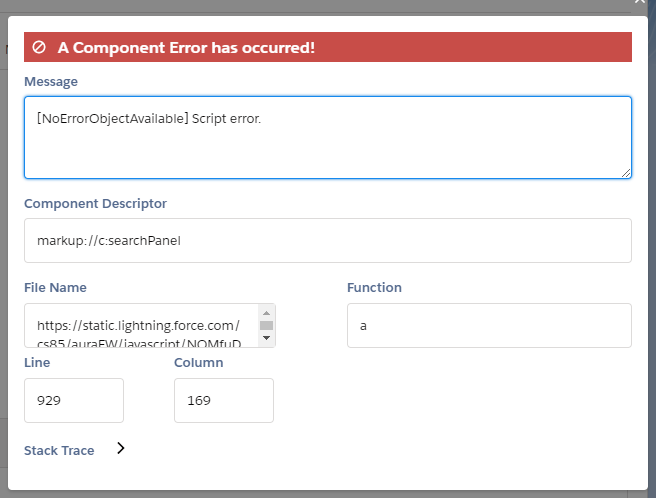
Debugging little javascript errors has become a nightmare (again.. feel like this is how it was a year ago and earlier). Simple errors it seems, like referencing a controller method that does not exist, give obfuscated errors now. Take this example, create the component below and add it to a page in a lightning community.
Simple component
<aura:component implements="forceCommunity:availableForAllPageTypes" access="global" >
    <aura:handler name="init" value="{!this}" action="{!c.doInit}"/>
</aura:component>
Now create a handler but leave it as it is by default/make sure it does not have a method called doInit. In a winter 19 org you get the error I mentioned, "This page has an error. You might just need to refresh it. [NoErrorObjectAvailable] Script error."
However, the same exact component in a summer 18 org gives you the error you can actually reasonably debug, since it says which component it is and what the problem is:
"This page has an error. You might just need to refresh it. Unknown controller action 'doInit' Callback failed: serviceComponent://ui.comm.runtime.components.aura.components.siteforce.controller.PubliclyCacheableComponentLoaderController/ACTION$getPageComponent Failing descriptor: {markup://c:testingErrors}"
This seems to be happening with almost all the javascript errors, like mishandling a return value from an apex controller, etc. When these components are nested and you're working with a bunch.. it is completely untenable to debug if we don't even have the identity of the component (referrals to developer therapists?).


