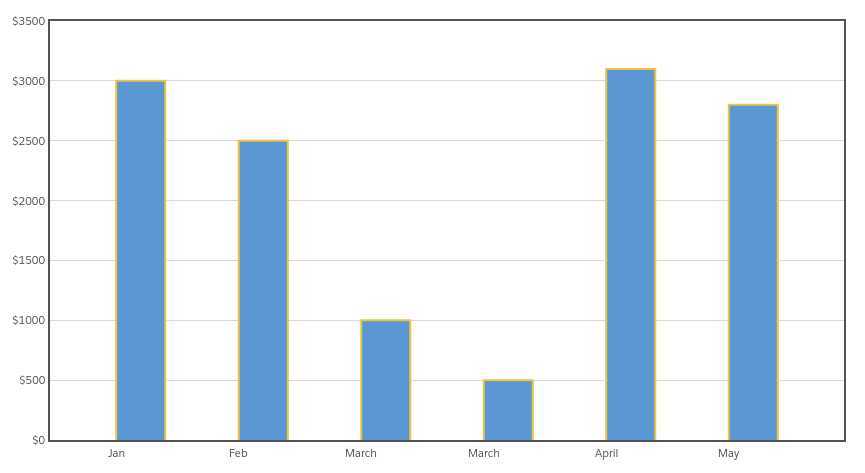
I've been using Flot.js to render some charts inside lightning components and everything worked fine until the new LockerService update was activated. As far as I researched, many people have had similar issues
Highcharts chart not rendering if LockerService is enabled
LockerService in Lightning Components is blocking Canvas element color fill completely
Can't set element.style.properties in JS inside Lightning Locker
but I couldn't find an answer that solves my problem. I basically created a minified example of how to render a chart with Flot.js to verify that the library is not the problem and this is what I've got:
Chart with LockerService deactivated (chart rendered as expected):
 Chart with Locker service activated(unexpected behavior):

So basically, Flot.js works fine without LockerService. This library is included using ltng:require tag and the chart is created in afterScriptsLoaded event. The problem is that the chart is not being render as I expected (first screenshot), so I debugged some parts of the code where the chart is set with styles in Flot.js and all seems to be working fine (I expected to see some errors since LockerService restricts the access to DOM elements between namespaces, but, as far as I see, nothing weird is happening). I also compared the HTML generated of both scenarios and I discovered that the problem is that, for some reason, LockerService prevents the chart's HTML to be updated with inline styles. For example:
One div of the chart correctly rendered is like:
<div class="flot-tick-label tickLabel" style="position: absolute; max-width: 141px; top: 432px; left: 98px; text-align: center;">Jan</div>
But, with LockerService activated it turns into:
<div class="flot-tick-label tickLabel">Jan</div>
and so on with the remaining divs/canvas in the chart.
The following js code is inside the controller of the lightning component and it's the code executed on afterScriptsLoaded:
({
    onFlotLoaded : function(component, event, helper) {
        var data = [["1", 3000],["2", 2500],["3", 1000],["4", 500],["5", 3100],["6", 2800]];
        var xticks = [["1", "Jan"],["2", "Feb"],["3", "March"],["4", "March"],["5", "April"],["6", "May"]];
        var options = {
            xaxis : {
                ticks : xticks,
                tickLength : 0,
                autoscaleMargin : .10
            },
            yaxis : {
                axisLabel : "Revenue",
                minTickSize : 1,
                tickFormatter : function numberWithCommas(x) {
                    return '$'+x;
                }
            },
            grid: {
                hoverable: true,
                borderWidth: 2
            }
        };

        $.plot("#placeholder", [{
            data : data,
            bars : { show: true, fill: 1, fillColor: "#5B97D5", barWidth: 0.4}
        }], options);
    }
})
Is this a LockerService issue? if not, is something wrong with the afterScriptsLoaded code? is there any available workaround?
Any help will be great.
Thanks
