0

I am pulling data from SF object into Einstein Analytics, and want to report on a number of sign ups for a service each month (for example, Contact, and Contact Created Date, grouped by year-month, and sum of sign ups for each date)

In EA I group it by year-month and I am able to see the number of new sign ups per month.

In EA Dashboard I want to show a timeline, how many people have signed up each month.

IF there are no current sign ups this month, my last date point in Compare Values Table will be for the previous month.

How can I constantly add a line with current year-month and a number of sign ups as 0, IF this date point is not pulled into the dataset, to ensure it shows all months in the timeline, and current month with 0 signs ups?

For example: Current month October, no sign ups, in Value Table I see:

2019-09 / 78 2019-08 / 20 etc....

But I want to add : 2019-10 / 0 on top?

Thank you so much

2 Answers 2

0

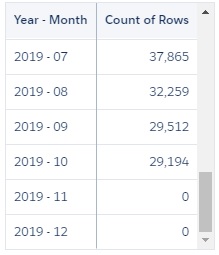
You could group your dataset by all, which results in one row. With that row you generate a Row for every month without using the actual values of the dataset (you just did that to have only one row). In the following example I did that for November and December.

Then you union your actual query with those "fake" rows. Do a grouping again, so you can add the 0 to the actual count if it exists.

q = load "MY_DATASET";
q = group q by ('Date__c_Year', 'Date__c_Month');
q = foreach q generate 'Date__c_Year' + "~~~" + 'Date__c_Month' as 'Year~~~Month', count() as 'count';
q = order q by 'Year~~~Month' asc;

qAll = group q by all;

qNov = foreach qAll generate "2019"+"~~~"+"11" as 'Year~~~Month', 0 as 'count';
qDec = foreach qAll generate "2019"+"~~~"+"12" as 'Year~~~Month', 0 as 'count';

qFinal = union q, qNov, qDec;
qFinal = group qFinal by 'Year~~~Month';
qFinal = foreach qFinal generate sum('count') as 'count', 'Year~~~Month';

result table

2
  • Thank you Patrick, that's brilliant
    – g4c
    Commented Nov 5, 2019 at 10:06
  • Thanks ;) Then please mark my answer as the solution
    – Patrick R.
    Commented Nov 6, 2019 at 6:39
0

Now this is built in to the product with the "Use Prior Values" option in the UI: https://help.salesforce.com/articleView?id=bi_chart_cumulative.htm&type=5

You must log in to answer this question.

Not the answer you're looking for? Browse other questions tagged .