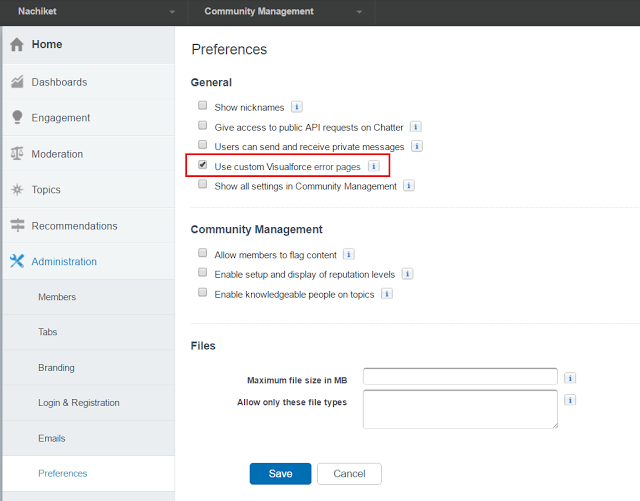
I am facing a vf page exception while logging into community with a couple of users. It works with other users. The only exception that I am able to see is VF: /apex/Exception. Nothing else is shown. I already set up trace flag with the user I am logging in to community. Is there any other way to debug the vf page.
23:03:19.0 (29787899)|VF_EVALUATE_FORMULA_END
23:03:19.0 (29793681)|VF_EVALUATE_FORMULA_BEGIN|06631000004Zwup|#
{NOT(ISPICKVAL($User.UserType,'Guest'))}
23:03:19.0 (29809758)|VF_EVALUATE_FORMULA_END
23:03:19.30 (30840830)|CUMULATIVE_LIMIT_USAGE
23:03:19.30 (30840830)|LIMIT_USAGE_FOR_NS|(default)|
  Number of SOQL queries: 0 out of 100
  Number of query rows: 0 out of 50000
  Number of SOSL queries: 0 out of 20
  Number of DML statements: 0 out of 150
  Number of DML rows: 0 out of 10000
  Maximum CPU time: 0 out of 10000
  Maximum heap size: 0 out of 6000000
  Number of callouts: 0 out of 100
  Number of Email Invocations: 0 out of 10
  Number of future calls: 0 out of 50
  Number of queueable jobs added to the queue: 0 out of 50
  Number of Mobile Apex push calls: 0 out of 10

23:03:19.30 (30840830)|TOTAL_EMAIL_RECIPIENTS_QUEUED|0
23:03:19.30 (30840830)|CUMULATIVE_LIMIT_USAGE_END

***23:03:19.0 (30905948)|CODE_UNIT_FINISHED|VF: /apex/Exception***
23:03:19.0 (31757330)|EXECUTION_FINISHED
23:03:19.32 (32709561)|CUMULATIVE_PROFILING_BEGIN
23:03:19.32 (32709561)|CUMULATIVE_PROFILING|No profiling information for SOQL operations
23:03:19.32 (32709561)|CUMULATIVE_PROFILING|No profiling information for SOSL operations
23:03:19.32 (32709561)|CUMULATIVE_PROFILING|No profiling information for DML operations
23:03:19.32 (32709561)|CUMULATIVE_PROFILING|No profiling information for method invocations
23:03:19.32 (32709561)|CUMULATIVE_PROFILING_END


