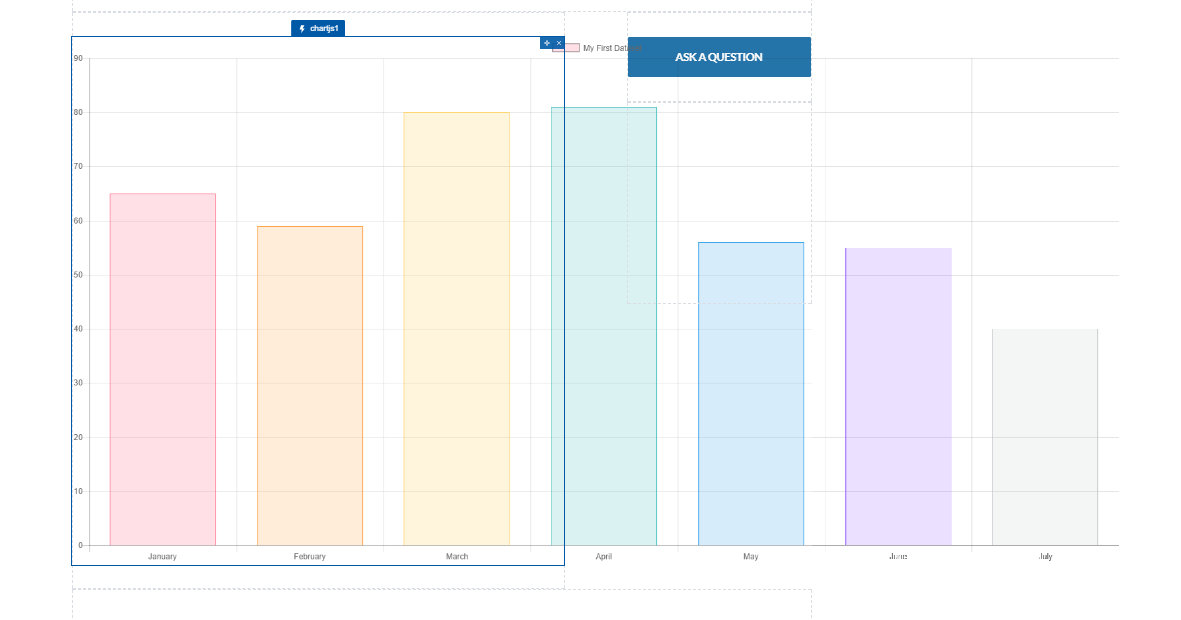
I'm trying to build a simple bar chart using Chart.js. When I try to view my page, my browser become irresponsive.
The Api version is 40
chartjs version is 2.1.4
- we are following this to build the chart.
ChartJsApp
 <aura:application >
    <ltng:require scripts="{!$Resource.ChartJs}" afterScriptsLoaded="{!c.scriptsLoaded}"/>
    <canvas aura:id="chart" />
</aura:application>
ChartJsAppController.js
({
    scriptsLoaded: function(cmp, event, helper) {
        var chart = new Chart(cmp.find("chart").getElement().getContext("2d"), {
            "type": "bar",
            "data": {
                "labels": [
                    "January",
                    "February",
                    "March",
                    "April",
                    "May",
                    "June",
                    "July"
                ],
                "datasets": [
                    {
                        "label": "My First Dataset",
                        "data": [
                            65,
                            59,
                            80,
                            81,
                            56,
                            55,
                            40
                        ],
                        "fill": false,
                        "backgroundColor": [
                            "rgba(255, 99, 132, 0.2)",
                            "rgba(255, 159, 64, 0.2)",
                            "rgba(255, 205, 86, 0.2)",
                            "rgba(75, 192, 192, 0.2)",
                            "rgba(54, 162, 235, 0.2)",
                            "rgba(153, 102, 255, 0.2)",
                            "rgba(201, 203, 207, 0.2)"
                        ],
                        "borderColor": [
                            "rgb(255, 99, 132)",
                            "rgb(255, 159, 64)",
                            "rgb(255, 205, 86)",
                            "rgb(75, 192, 192)",
                            "rgb(54, 162, 235)",
                            "rgb(153, 102, 255)",
                            "rgb(201, 203, 207)"
                        ],
                        "borderWidth": 1
                    }
                ]
            },
            "options": {
                "scales": {
                    "yAxes": [
                        {
                            "ticks": {
                                "beginAtZero": true
                            }
                        }
                    ]
                }
            }
        });

    }
})
Note :
i tried lastest version of chartjs and i got same behavior

