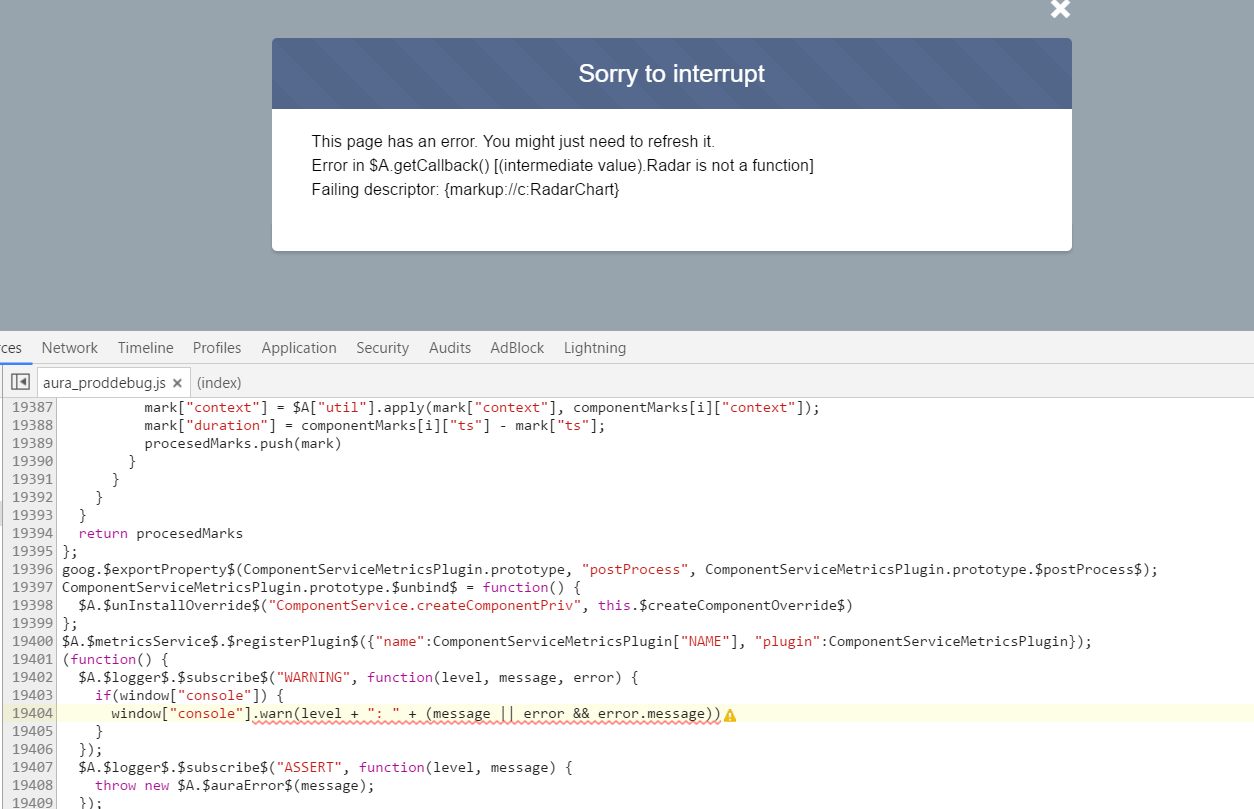
I am trying to follow the chart example listed in salesforce doc and a blog, i am getting an error on the JS load functionality as below and the charts are not getting loaded and i get the error screen that Radar.function(xxxX) is not valid.
I have used a static resource with name chart_js and included in the component. Is there anything missing?
below is my code :
Component:
<ltng:require scripts="{!$Resource.chart_js}" afterScriptsLoaded="{!c.init}"/>

    <div class="heading">
        Radar Chart showing Lead count by Source
    </div>

    <div>
        <canvas aura:id="radarChart" id="radarCHart123" width="400" height="400"/>
    </div>

</aura:component>
JS controller
({
    init : function(component, event, helper) {
        helper.setupRadarChart(component);
    }
})
Helper
 ({
        setupRadarChart : function(component) {

        var action = component.get("c.getLeadJSON");
        action.setCallback(this, function(a){
            var jsonRetVal = JSON.parse(a.getReturnValue());
            console.log(jsonRetVal.radarLabels);

            var radarChartData = {
            labels: jsonRetVal.radarLabels,
            datasets: [
                {
                    fillColor: "rgba(220,220,220,0.2)",
                    strokeColor: "rgba(220,220,220,1)",
                    pointColor: "rgba(220,220,220,1)",
                    pointStrokeColor: "#fff",
                    pointHighlightFill: "#fff",
                    pointHighlightStroke: "rgba(220,220,220,1)",
                    data: jsonRetVal.radarData
                }
            ]
        };

        var el = component.find('radarChart').getElement();
        var ctx = el.getContext('2d');
        new Chart(ctx).Radar(radarChartData);

        });
        $A.enqueueAction(action);
    },

})


