2

I have an issue where i run an apex class and print some objects along the way to log using System.debug().

my problem is that for some reason, the log rows are getting written, but the value of the objects is being "trimmed". the size that it prints and which gets trimmed isn't consistent (sometimes it prints a lot of content sometimes less) but it does not write the entirety of the objects values i choose to log. It does this to both SObjects and json encoded strings, and my entire log size is just about 80KB so i know i'm not breaking some size limit.

I also checked my log levels and everything is set as it should (again my logs are being written just not "fully").

for example, I have the json string:

[{"sum":"2300","serial":"","repaymentDate":null,"payment":{"attributes":{"type":"Payment__c"},"Payment_Method__c":"Cash","checkdate__c":null,"Payment_Collected_Date__c":"2019-03-11"},"ownerId":null,"numOfPayments":null,"firstPaymentAmount":null,"digits":null,"cardType":null,"branch":null,"bank":"","account":""}

But it gets written to the log file as:

15:29:57:085 USER_DEBUG [69]|DEBUG|payments json: [{"sum":"2300","serial":"","repaymentDate":null,"payment":{"attributes":{"type":"Payment__c"},"Payment_Method__c":"Cash","checkdate__c":null,"Payment_Collected_Date__c":"2019-03-11"},"ownerId":null,"numOfPayments":null,"firstPaymentAmount":null,"digits":null,"cardType":null,"branch":nu

any ideas?

4 Answers 4

4

Update: This is now specifically called out in the release notes.

Developer Console: String Values in Debug Logs Are Truncated

To help prevent connection pool timeouts caused by exceptionally large queries, strings are now truncated at 512 characters in the Developer Console’s Log Inspector. This truncation applies to all string values in the Execution Log panel and to SOQL queries in the Source panel. You can view the complete string in a raw log file.


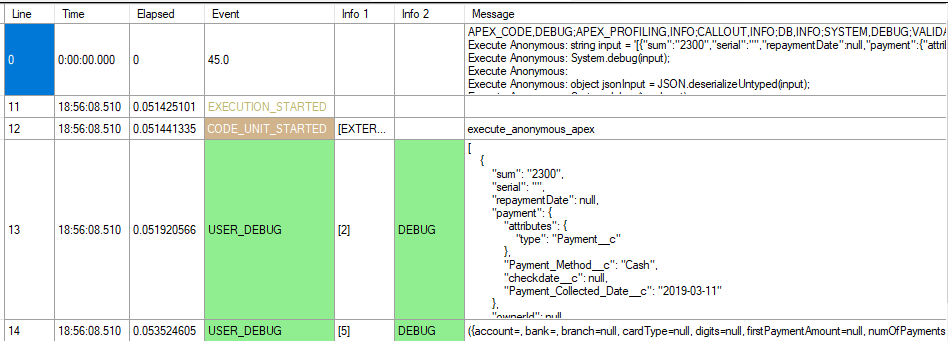
I'm not able to replicate this issue with anonymous Apex. I tested with the following against the v45.0 API.

string input = '[{"sum":"2300","serial":"","repaymentDate":null,"payment":{"attributes":{"type":"Payment__c"},"Payment_Method__c":"Cash","checkdate__c":null,"Payment_Collected_Date__c":"2019-03-11"},"ownerId":null,"numOfPayments":null,"firstPaymentAmount":null,"digits":null,"cardType":null,"branch":null,"bank":"","account":""}]';
System.debug(input);

object jsonInput = JSON.deserializeUntyped(input);
System.debug(jsonInput);

Raw Log Output:

18:56:08.51 (51441335)|CODE_UNIT_STARTED|[EXTERNAL]|execute_anonymous_apex
18:56:08.51 (51920566)|USER_DEBUG|[2]|DEBUG|[{"sum":"2300","serial":"","repaymentDate":null,"payment":{"attributes":{"type":"Payment__c"},"Payment_Method__c":"Cash","checkdate__c":null,"Payment_Collected_Date__c":"2019-03-11"},"ownerId":null,"numOfPayments":null,"firstPaymentAmount":null,"digits":null,"cardType":null,"branch":null,"bank":"","account":""}]
18:56:08.51 (52063319)|SYSTEM_MODE_ENTER|false
18:56:08.51 (53449211)|SYSTEM_MODE_EXIT|false
18:56:08.51 (53524605)|USER_DEBUG|[5]|DEBUG|({account=, bank=, branch=null, cardType=null, digits=null, firstPaymentAmount=null, numOfPayments=null, ownerId=null, payment={Payment_Collected_Date__c=2019-03-11, Payment_Method__c=Cash, attributes={type=Payment__c}, checkdate__c=null}, repaymentDate=null, ...})

I'd expect the JSON object to be truncated in a System.debug(), but not a raw string.

What I did find was that the Developer Console was truncating it in the Details column: enter image description here

So, either work with the raw log, or (shameless self promotion for a free tool I make) use and alternative log viewer. enter image description here

2
  • Viewing the raw log gives me the line with the "(X more)" text in it, so it still doesn't show the full logged line. Thank you though for the free tool! I used it and managed to see the entirety of the line. Unfortunately i'm not sure if it is considered an actual solution to the problem, so i'm not sure if i should mark this as the answer.
    – RealGigex
    Commented Mar 14, 2019 at 9:15
  • @RealGigex I believe the underlying problem is with how the developer console is displaying the log rather than the log itself. They only other possible option I can think of is to use the "Download Log" link that is below the "Open Raw Log" link. Although in theory that should be identical to the raw log. Commented Mar 14, 2019 at 18:27
2

I have received the answer to this issue from the official salesforce support team. Apparently:

Product team truncated log lines to fix an issue with large strings. This change was made recently to help prevent connection pool timeouts that exceptionally large queries could cause.

I don't really see how truncating the already queried lines can prevent the queries from running in the first place, but that is what they said

As i see it this is pretty much the answer: yes, logs are truncated. yes, it's intentional.

Daniel Ballinger provided a third party tool that works pretty well for me so i guess that is the solution for now.

0

Open Source tool https://workbench.developerforce.com/ gives perfect output for this. it is worked for me for full untrimmed debug log.

1
  • I don't see how this tool logs live actions, like visualforce pages i submit data to and controllers code running
    – RealGigex
    Commented Apr 28, 2019 at 6:59
0

You can see the raw of the message with this key combination without trim. Ctrl+Shift+G

2
  • 1
    Can't find the second key on my keyboard, is this keyboard specifically for debugging? Commented Nov 8, 2023 at 21:11
  • 1
    Ahah after many years, I just realized that. Thank you and sorry for the typo :) Commented Nov 9, 2023 at 13:14

You must log in to answer this question.

Not the answer you're looking for? Browse other questions tagged .