i am trying to recreate a visualforce bar chart example as documented in here http://www.salesforce.com/us/developer/docs/pages/Content/pages_charting_overview_providing_data_controller_method.htm
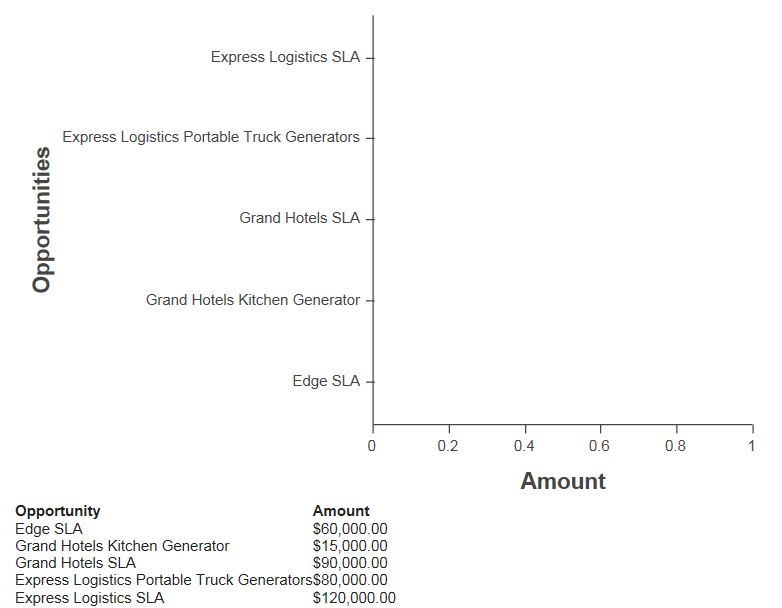
I have copy pasted the code.and it doesnt give an error.But my result graph doesnt actually have any bars at all.Although can see is coming through.What should i change ?
Apexcode:
public class oppcontro {
// Get a set of Opportunities
    public ApexPages.StandardSetController setCon {
        get {
            if(setCon == null) {
                setCon = new ApexPages.StandardSetController(Database.getQueryLocator(
                      [SELECT name, type, amount, closedate FROM Opportunity]));
                setCon.setPageSize(5);
            }
            return setCon;
        }
        set;
    }

    public List<Opportunity> getOpportunities() {
         return (List<Opportunity>) setCon.getRecords();
    }
}
APEXPAGE
    <apex:page controller="oppcontro">
        <apex:chart data="{!Opportunities}" width="600" height="400">
            <apex:axis type="Category" position="left" fields="Name" title="Opportunities"/>
            <apex:axis type="Numeric" position="bottom" fields="Amount" title="Amount"/>
            <apex:barSeries orientation="horizontal" axis="bottom"
                xField="Name" yField="Amount"/>
        </apex:chart>
        <apex:dataTable value="{!Opportunities}" var="opp">
            <apex:column headerValue="Opportunity" value="{!opp.name}"/>
            <apex:column headerValue="Amount" value="{!opp.amount}"/>
        </apex:dataTable>

</apex:page>
SCREENSHOT OF GRAPH

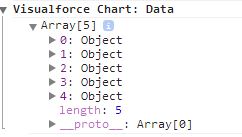
JAVASCRIPT CONSOLE SCREENSHOT
