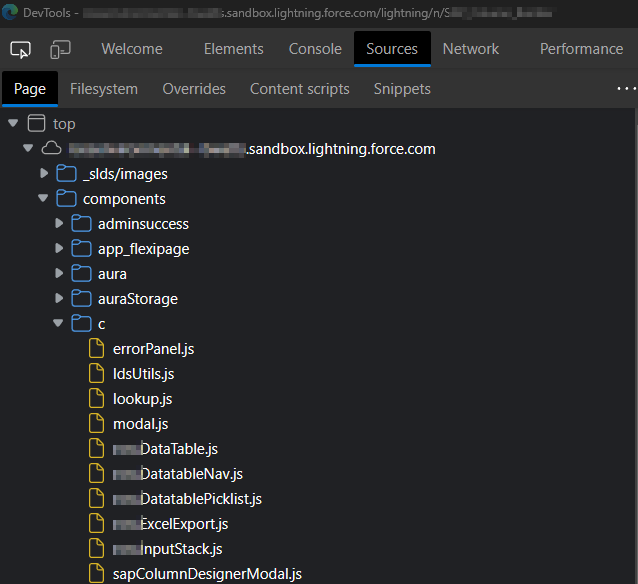
The new Lightning Web Security model that is set to overtake Lightning Locker is not working the way the SF docs explain. In short: I do not have an 'lws' folder.
From developer.salesforce.com:
When your components run in an org where Lightning Web Security is enabled, look for the lws folder near the bottom of the Page pane. Expand the folder and see your component files organized under their namespace folder.
Here you see the c namespace and its components on the current page (1). The same compositionBasics.js file with LWS enabled is shown with source mapping (2).
I can only see the source code under top/components/c as I show below, but, my F12 Developer tools do not allow me to set breakpoints anywhere
I feel like it did work breifly at one point for me, but I have to disable LWS to do any kind of debugging currently. Anyone else experiencing this?
UPDATE 1:
I think perhaps there's something about my home network causing this.
The 'lws' folder does indeed appear as advertised if I debug from my work-provided workstation (I remote into it), but it does NOT work from Chrome or Edge on my home workstation (I turned off my work VPN, thinking it was the culprit, but still no luck)
UPDATE 2:
Even on my work PC, although the lwc folder displays - the breakpoints do not hit unless I put a debugger; statement in the script, and even then, it doesn't seem be hitting in the correct spots.

