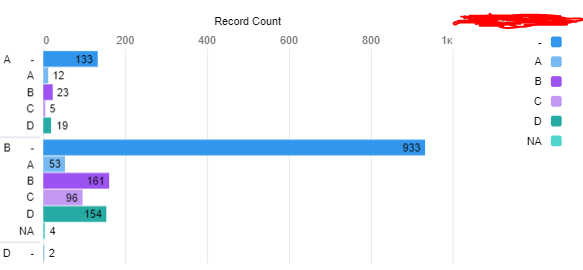
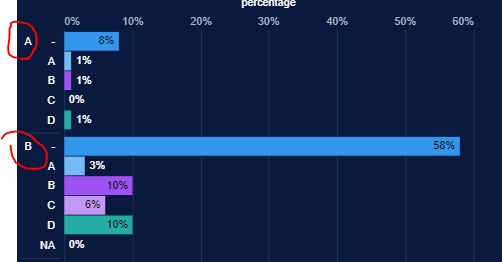
I have a chart showing following information but now i need to have instead of numbers the percentage. Now it shows percentage of all records. But im interested if its possible to count % separately for A, and separately for B and D. How should i write formula? I'm vey new with SF
-
Welcome to SSE ! Do you want the % of count ?– SaiPraveen KakkiralaCommented Dec 21, 2022 at 11:10
-
@SaiPraveenKakkirala yes, exactly– KseFCommented Dec 21, 2022 at 11:43
-
@SaiPraveenKakkirala your advice is very good. I have updated my question, can you have a look if the formula can be improved to show % for A, B and D I mean if we look at A, then it has 133 records and its around 60%– KseFCommented Dec 21, 2022 at 12:25
-
Do you want percentage calculation different. Are these on same report? or have to added them as matrix of reports?– SaiPraveen KakkiralaCommented Dec 21, 2022 at 12:30
-
@SaiPraveenKakkirala yes, i want % be calculated differently. I wandering if its possible to calculate 100% of records for A (B and D) separately. Like total record for A is 190 Then -133 is around 70% A 12 is around 5% B 23 is around 12% C 5 is around 3% D 19 is around– KseFCommented Dec 21, 2022 at 12:46
|
Show 2 more comments
2 Answers
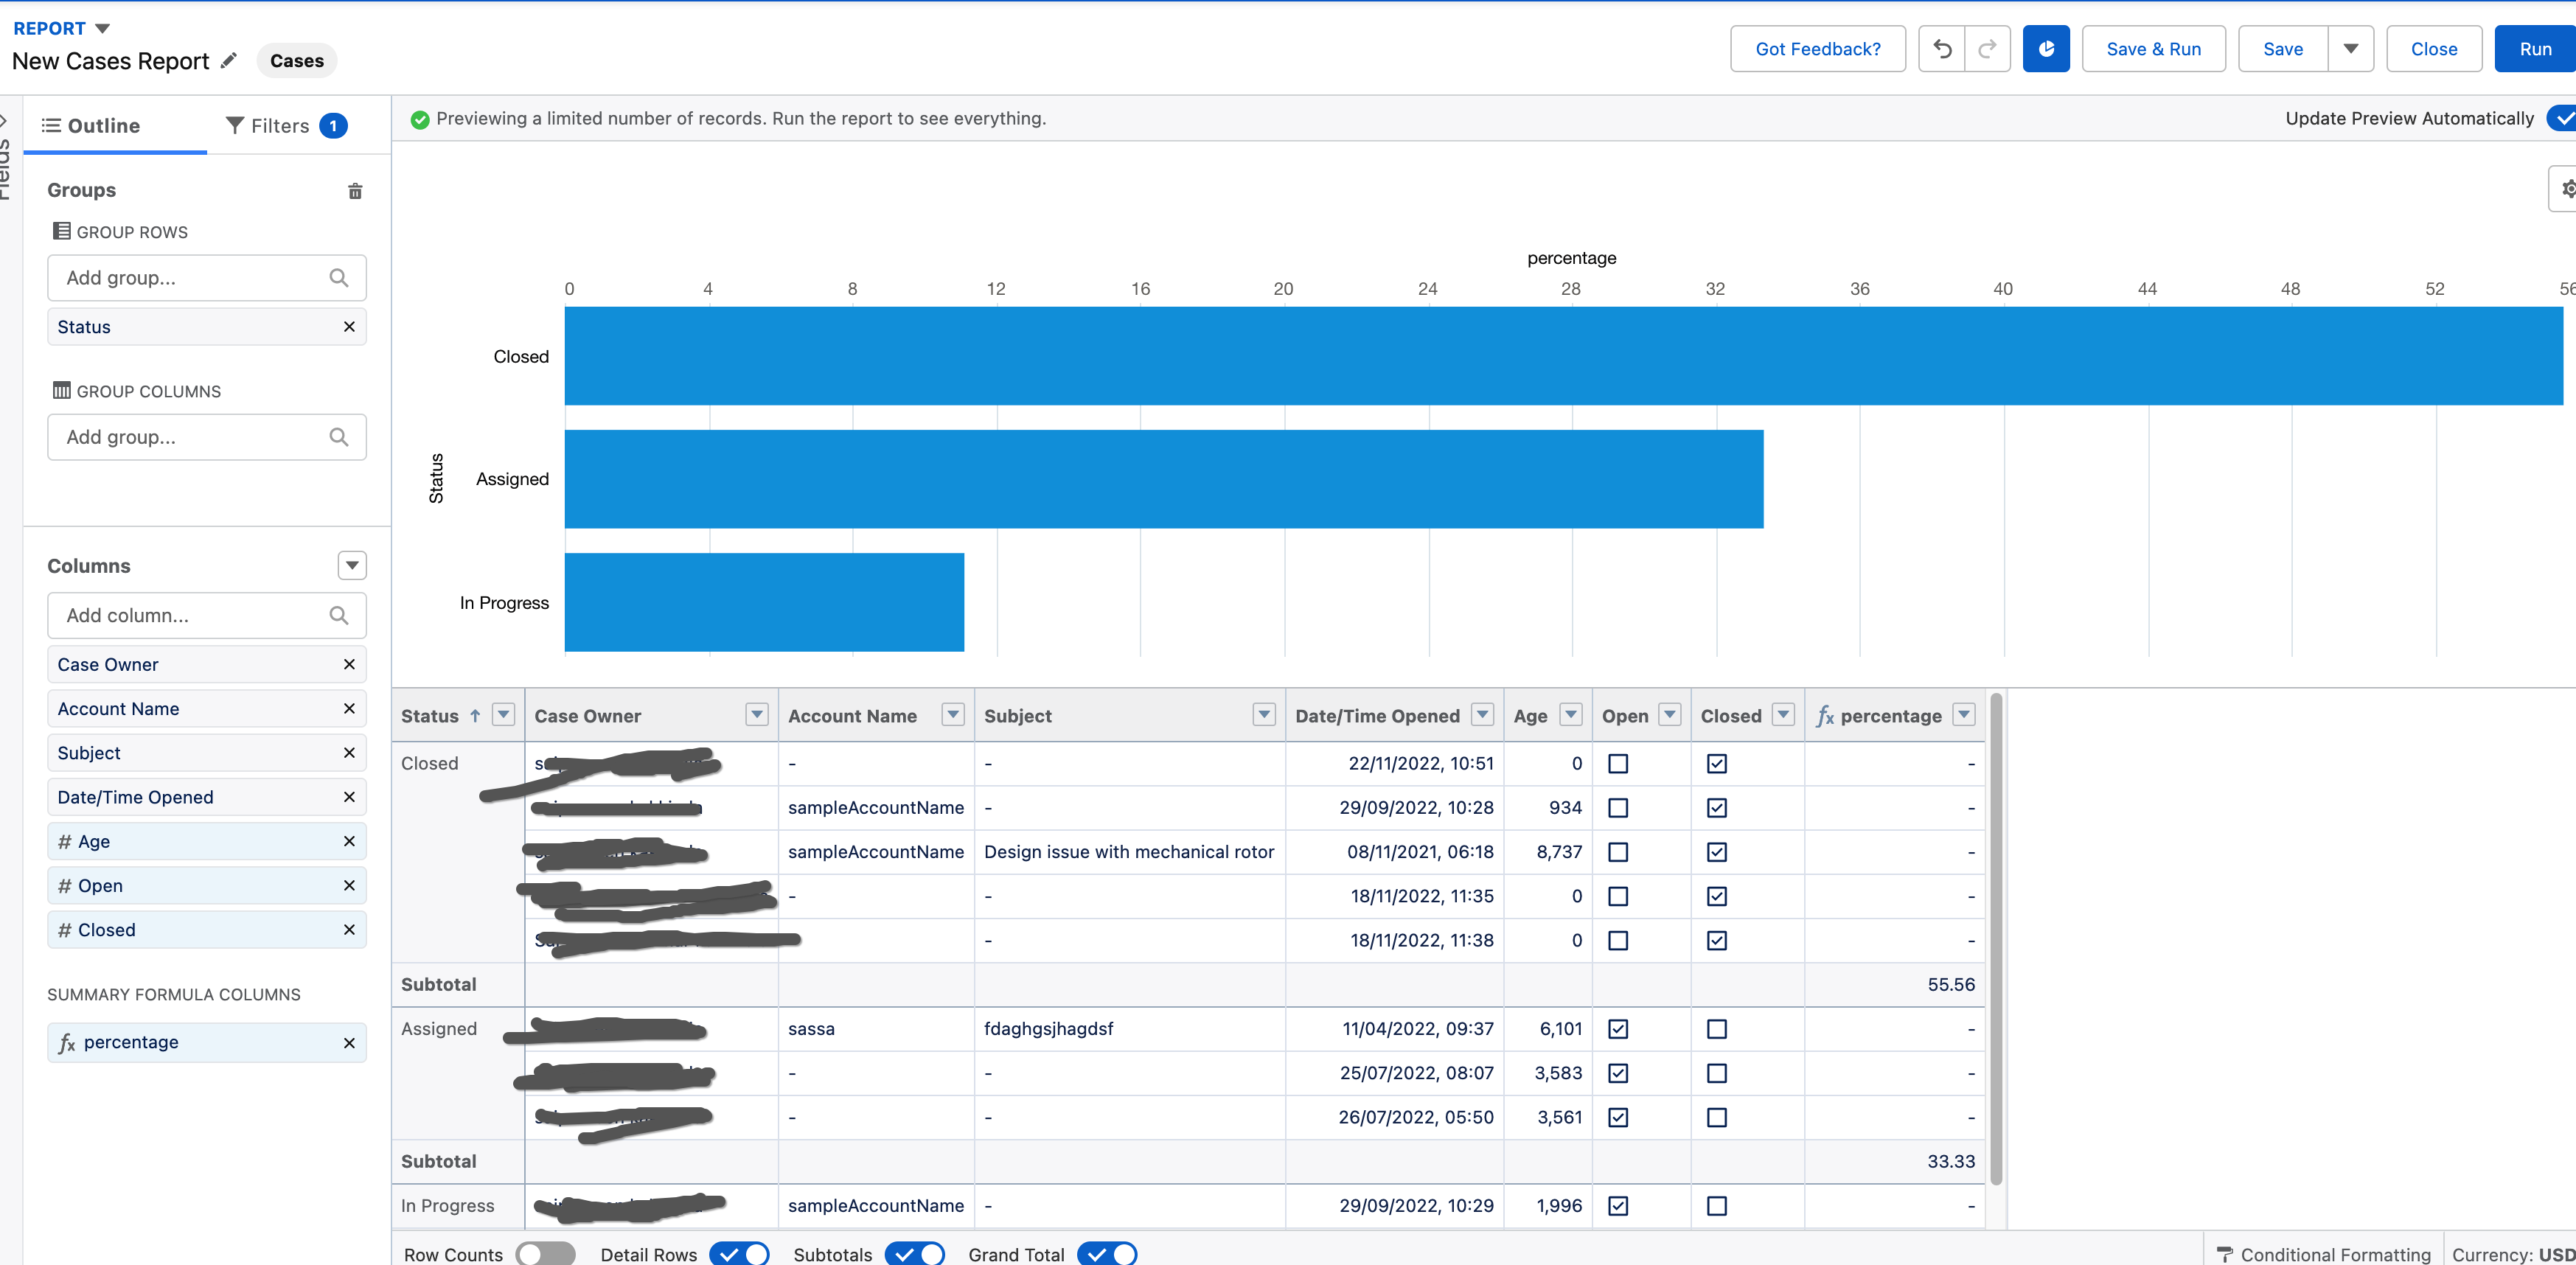
You can create a formula field in the report to show the percentage. The formula should be as below.
(RowCount / PARENTGROUPVAL(RowCount, GRAND_SUMMARY)) *100
Please find the article for the same


