I have a lightning component elfTest1 used on a page elf. The page itself is used as internal URL in the community builder wired via the menu.
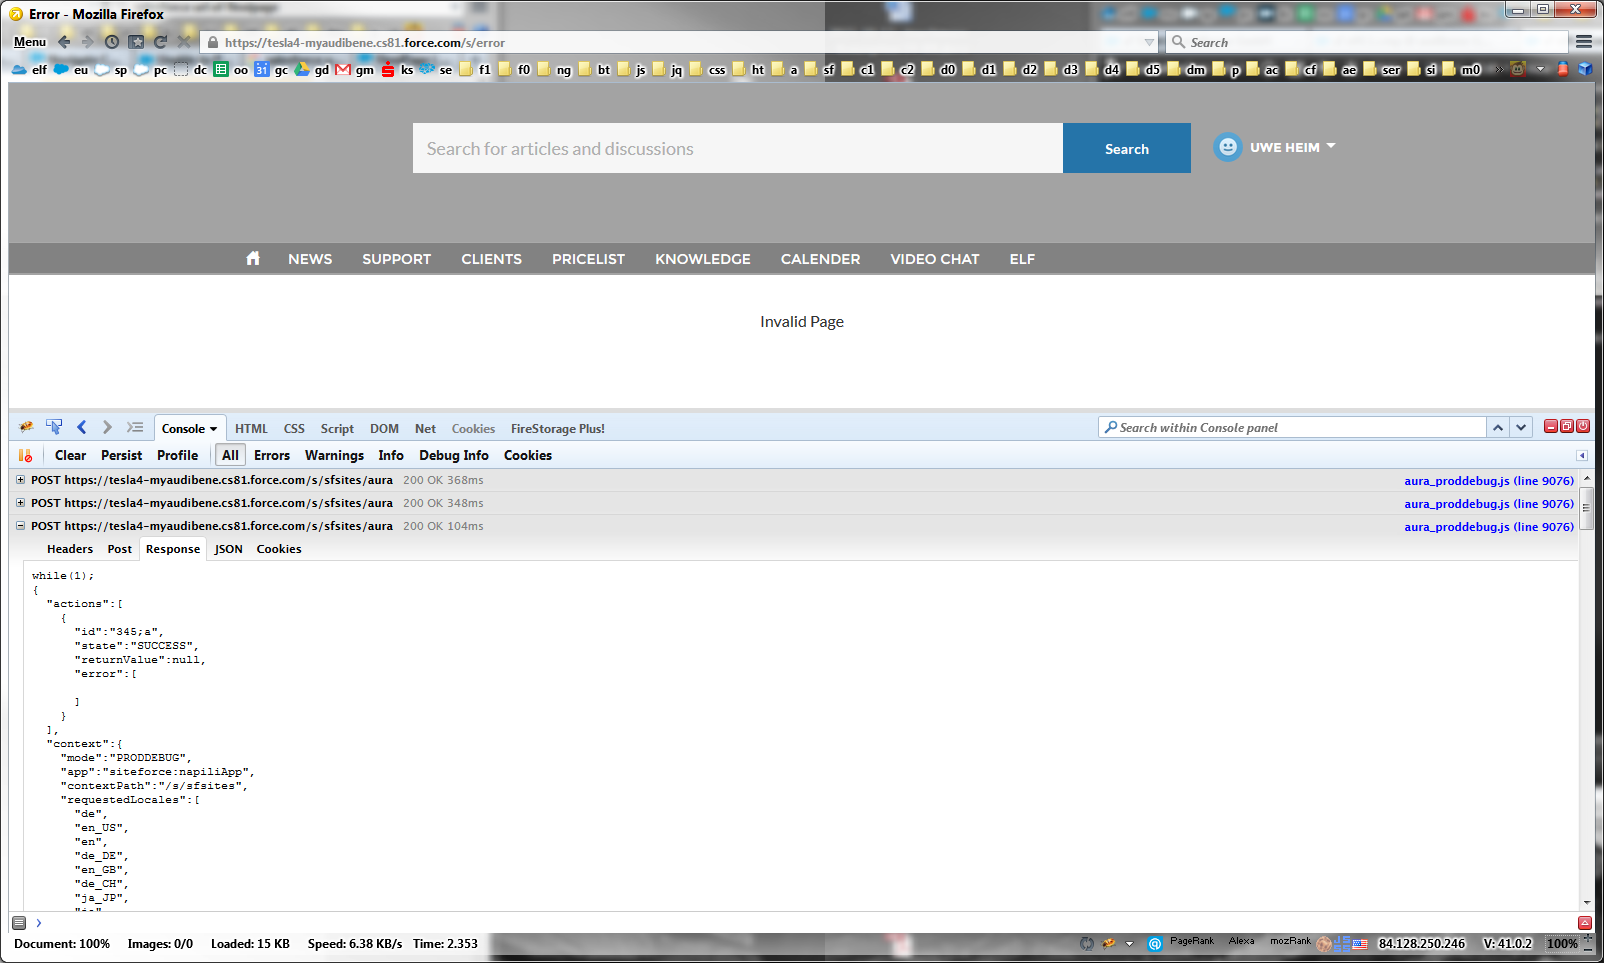
Now in case of a JavaScript error in elfTest1Controller.js and when loading the error-page in the community builder, it rerouts to /s/error, which shows a 'Invalid Page' at the content-area, with not much information.
Now my code is simple and I provoked the error on purpose and I know exactly where it is.
But in case of complex projects dealing with non-trivial errors in JavaScript, where can I see some debug information? In the browser console I see three ajax calls (from aura_proddebug.js) but they are all successful - even in case of errors. The responses are very verbose, hard to read - I'm not sure if they are intended to be read by humans... also I found no error in there... So is there an other place to look?
How do you test-run your component in a page? Where is the best place to get readable debug information, with at least the error-line-number or a stacktrace (which is usually running nice out-of-the box in the browser console)?
Hopefully you don't point me straight to the developer console. I'm already afraid you will... At this moment I don't use it and I don't like it.
Is it possible to turn that routing completely OFF? Not to stick on the URL makes it impossible to reload the page again after a code-fix by pressing F5, instead we need to navigate back by clicking the menu. On the other hand always clicking the menu, does not bring up the current version of all components but a cached version. This is misleading somehow.
Lightning Components - Debug Mode
In the setup at Develop > Lightning Components there is a checkbox "Enable Debug Mode", which I have already checked. I can see a difference only in the Lightning Experice UI, but not in the Community created by Community Builder. Does this Debug Mode play together with the Community or not?

