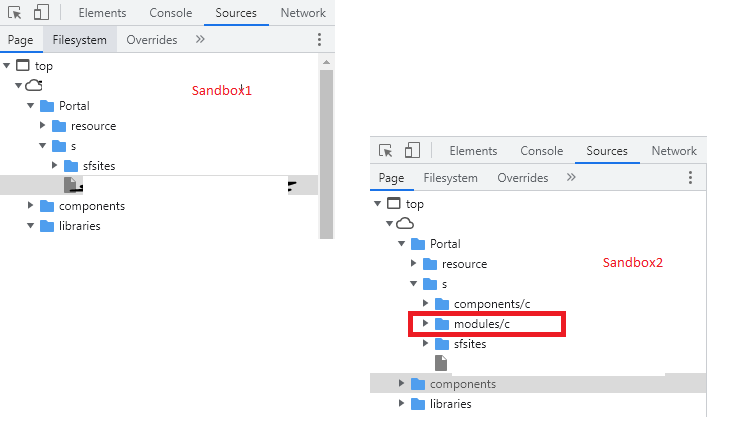
I am trying to debug LWC JavaScript using Chrome's DevTools. However I am unable to see /modules/c component under sources tab of Chrome DevTools. The same is working fine for other sandbox. Does anyone know the root cause behind this? I need to debug this for guest user therefore I am unable to enable debug mode as well.
4 Answers
I ran across this issue too and posted more about it here: https://saramorgan.net/2022/10/17/workaround-for-issue-debugging-lwc-in-chrome-dev-tools-after-winter-2023/
I faced the same issue. For me it appeared after Winters' 23 release. Apparently Salesforce forced Lightning Web Security with this release. (see release notes: https://help.salesforce.com/s/articleView?id=release-notes.rn_experiences_lws_default.htm&type=5&release=240)
To fix this I had to deactivate LWS which I was able to do at
Setup > Security > Session Settings > Lightning Web Security > Use Lightning Web Security for Lightning web components
API version 56.0 (Winter '23) has a different file structure in DevTools and has seems to have a lot of issues like not breaking on the correct line.
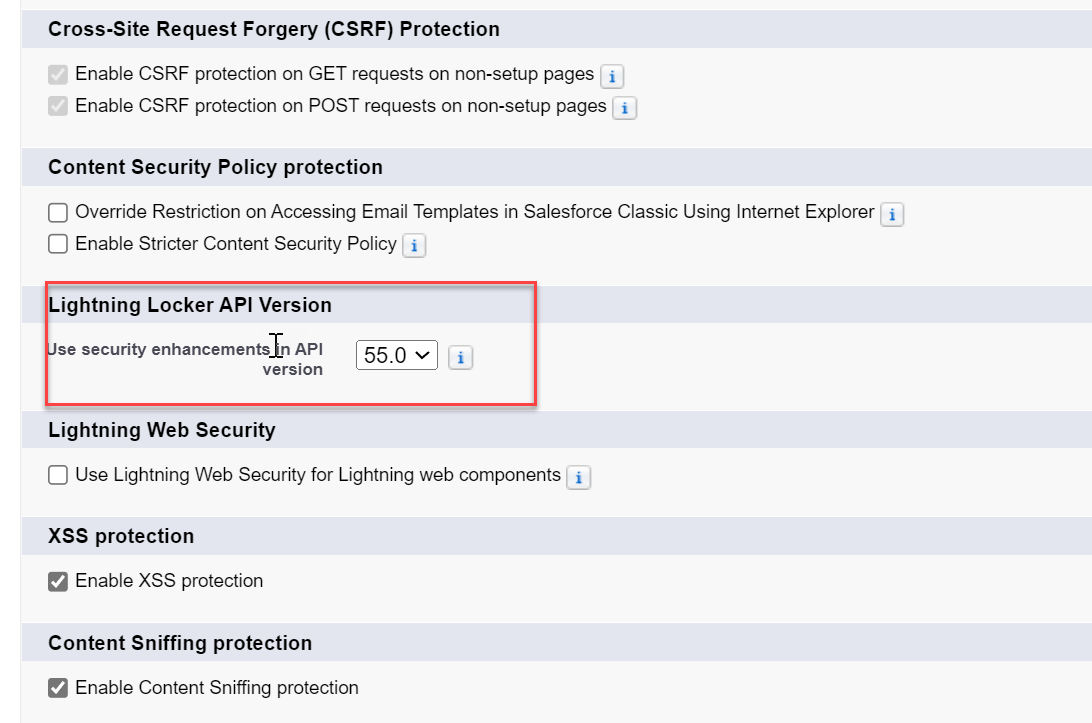
Go to: Setup > Security > Session Settings
- Lightning Locker API Version: Set the "Use security enhancements in API version" back to "55.0" to get the old file structure back in DevTools.
- Lightning Web Security: Uncheck "Use Lightning Web Security for Lightning web components"
I also had to disable "Enable Stricter Content Security Policy" in Session Settings to get the modules folder to show. After I did this, API 56.0 also worked for me.
-
None of the solutions here make the sources appear in my chrome dev tools. Is this still working for you?– sskularCommented Nov 14, 2022 at 13:32


