1

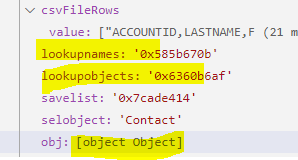
I've started using Visual Studio Code to run through my debug logs, but am not seeing the content of certain types of variables and am wondering whether I'm just missing something or whether this isn't possible? Below is my Local variables section, where my maps and objects show like this - I can't see the content, which is what I need to see to debug my problem. What do I need to do in order to see the content of these variables during my debug session?

public SObject obj {get;set;}
Map<Integer, fieldWrapper> colNames {get;set;} 
Map<string, list<string>> lookupnames {get;set;}
Map<string, sObject> lookupobjects {get;set;}

enter image description here

2 Answers 2

3

enter image description here

Limitations of Apex Replay Debugger in VS Code https://developer.salesforce.com/tools/vscode/en/apex/replay-debugger

This is under the "Considerations" section. I don't even think using checkpoints helps this either. I simply continue to utilize System.debug() when I'm testing an issue like this with maps/lists.

0

You can try to use the JetForcer plugin for Salesforce development in JetBrains IDEs (I participate in developing it).

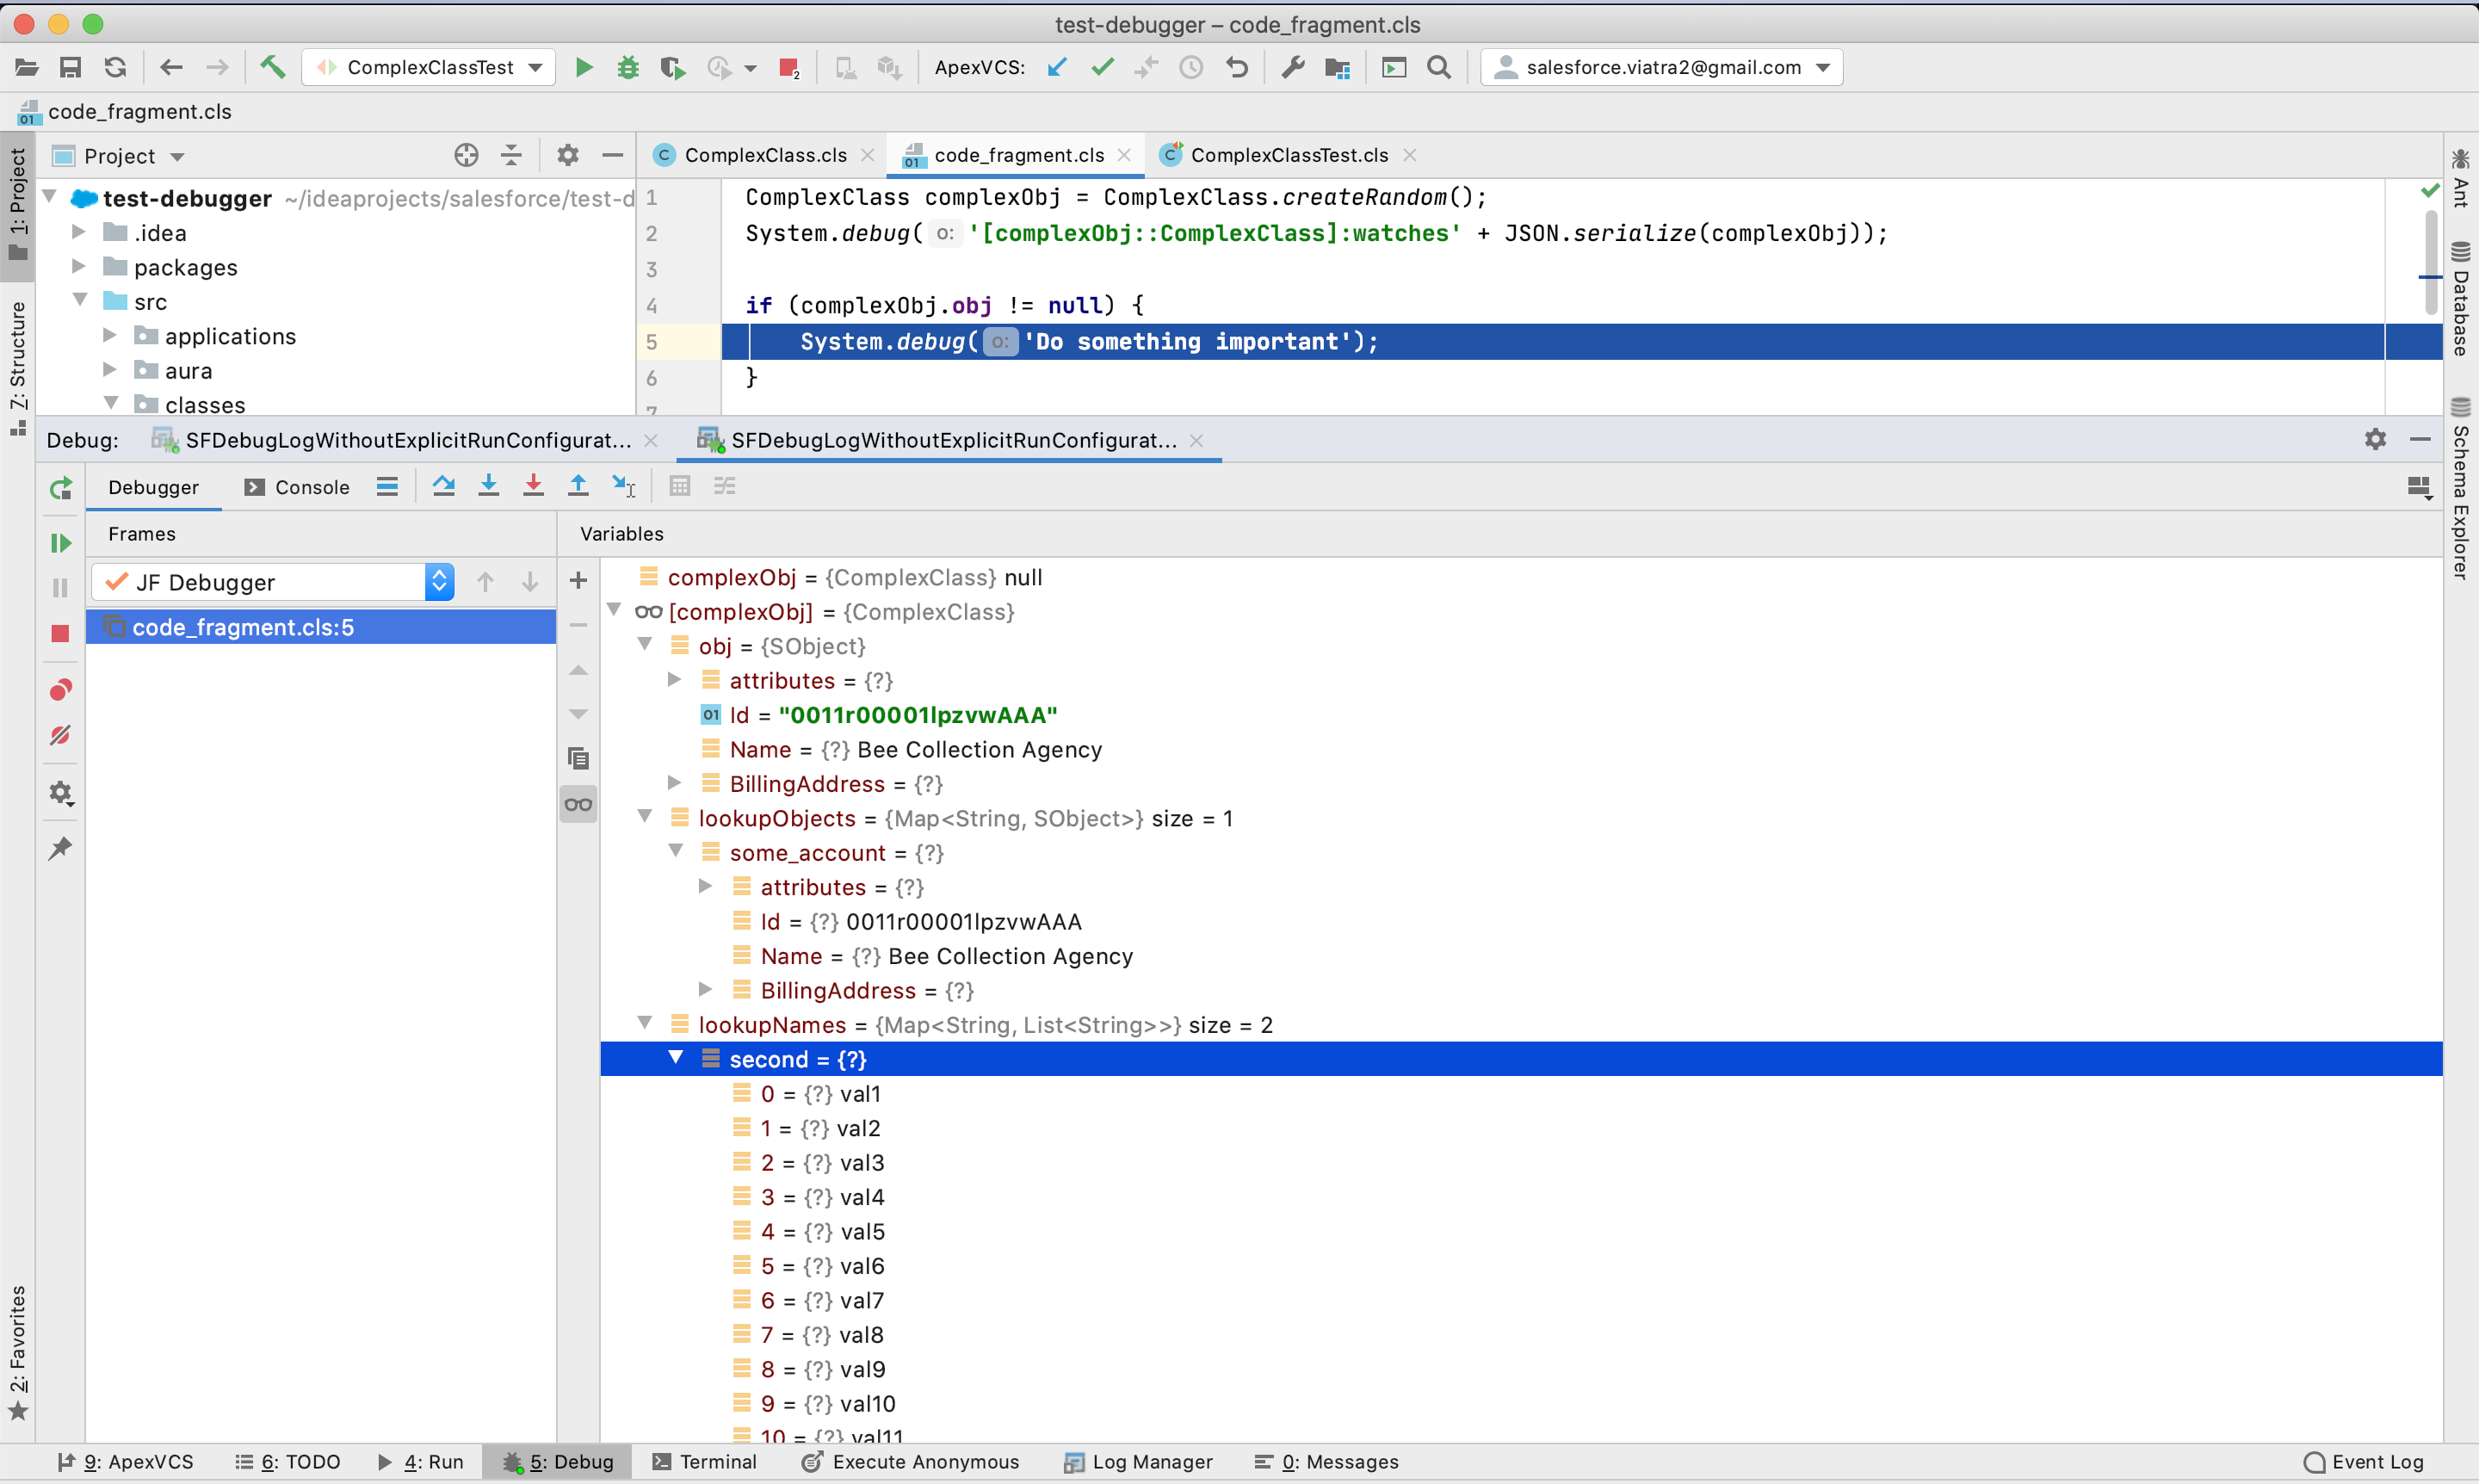
It provides the ability to explore complex objects during debugging.

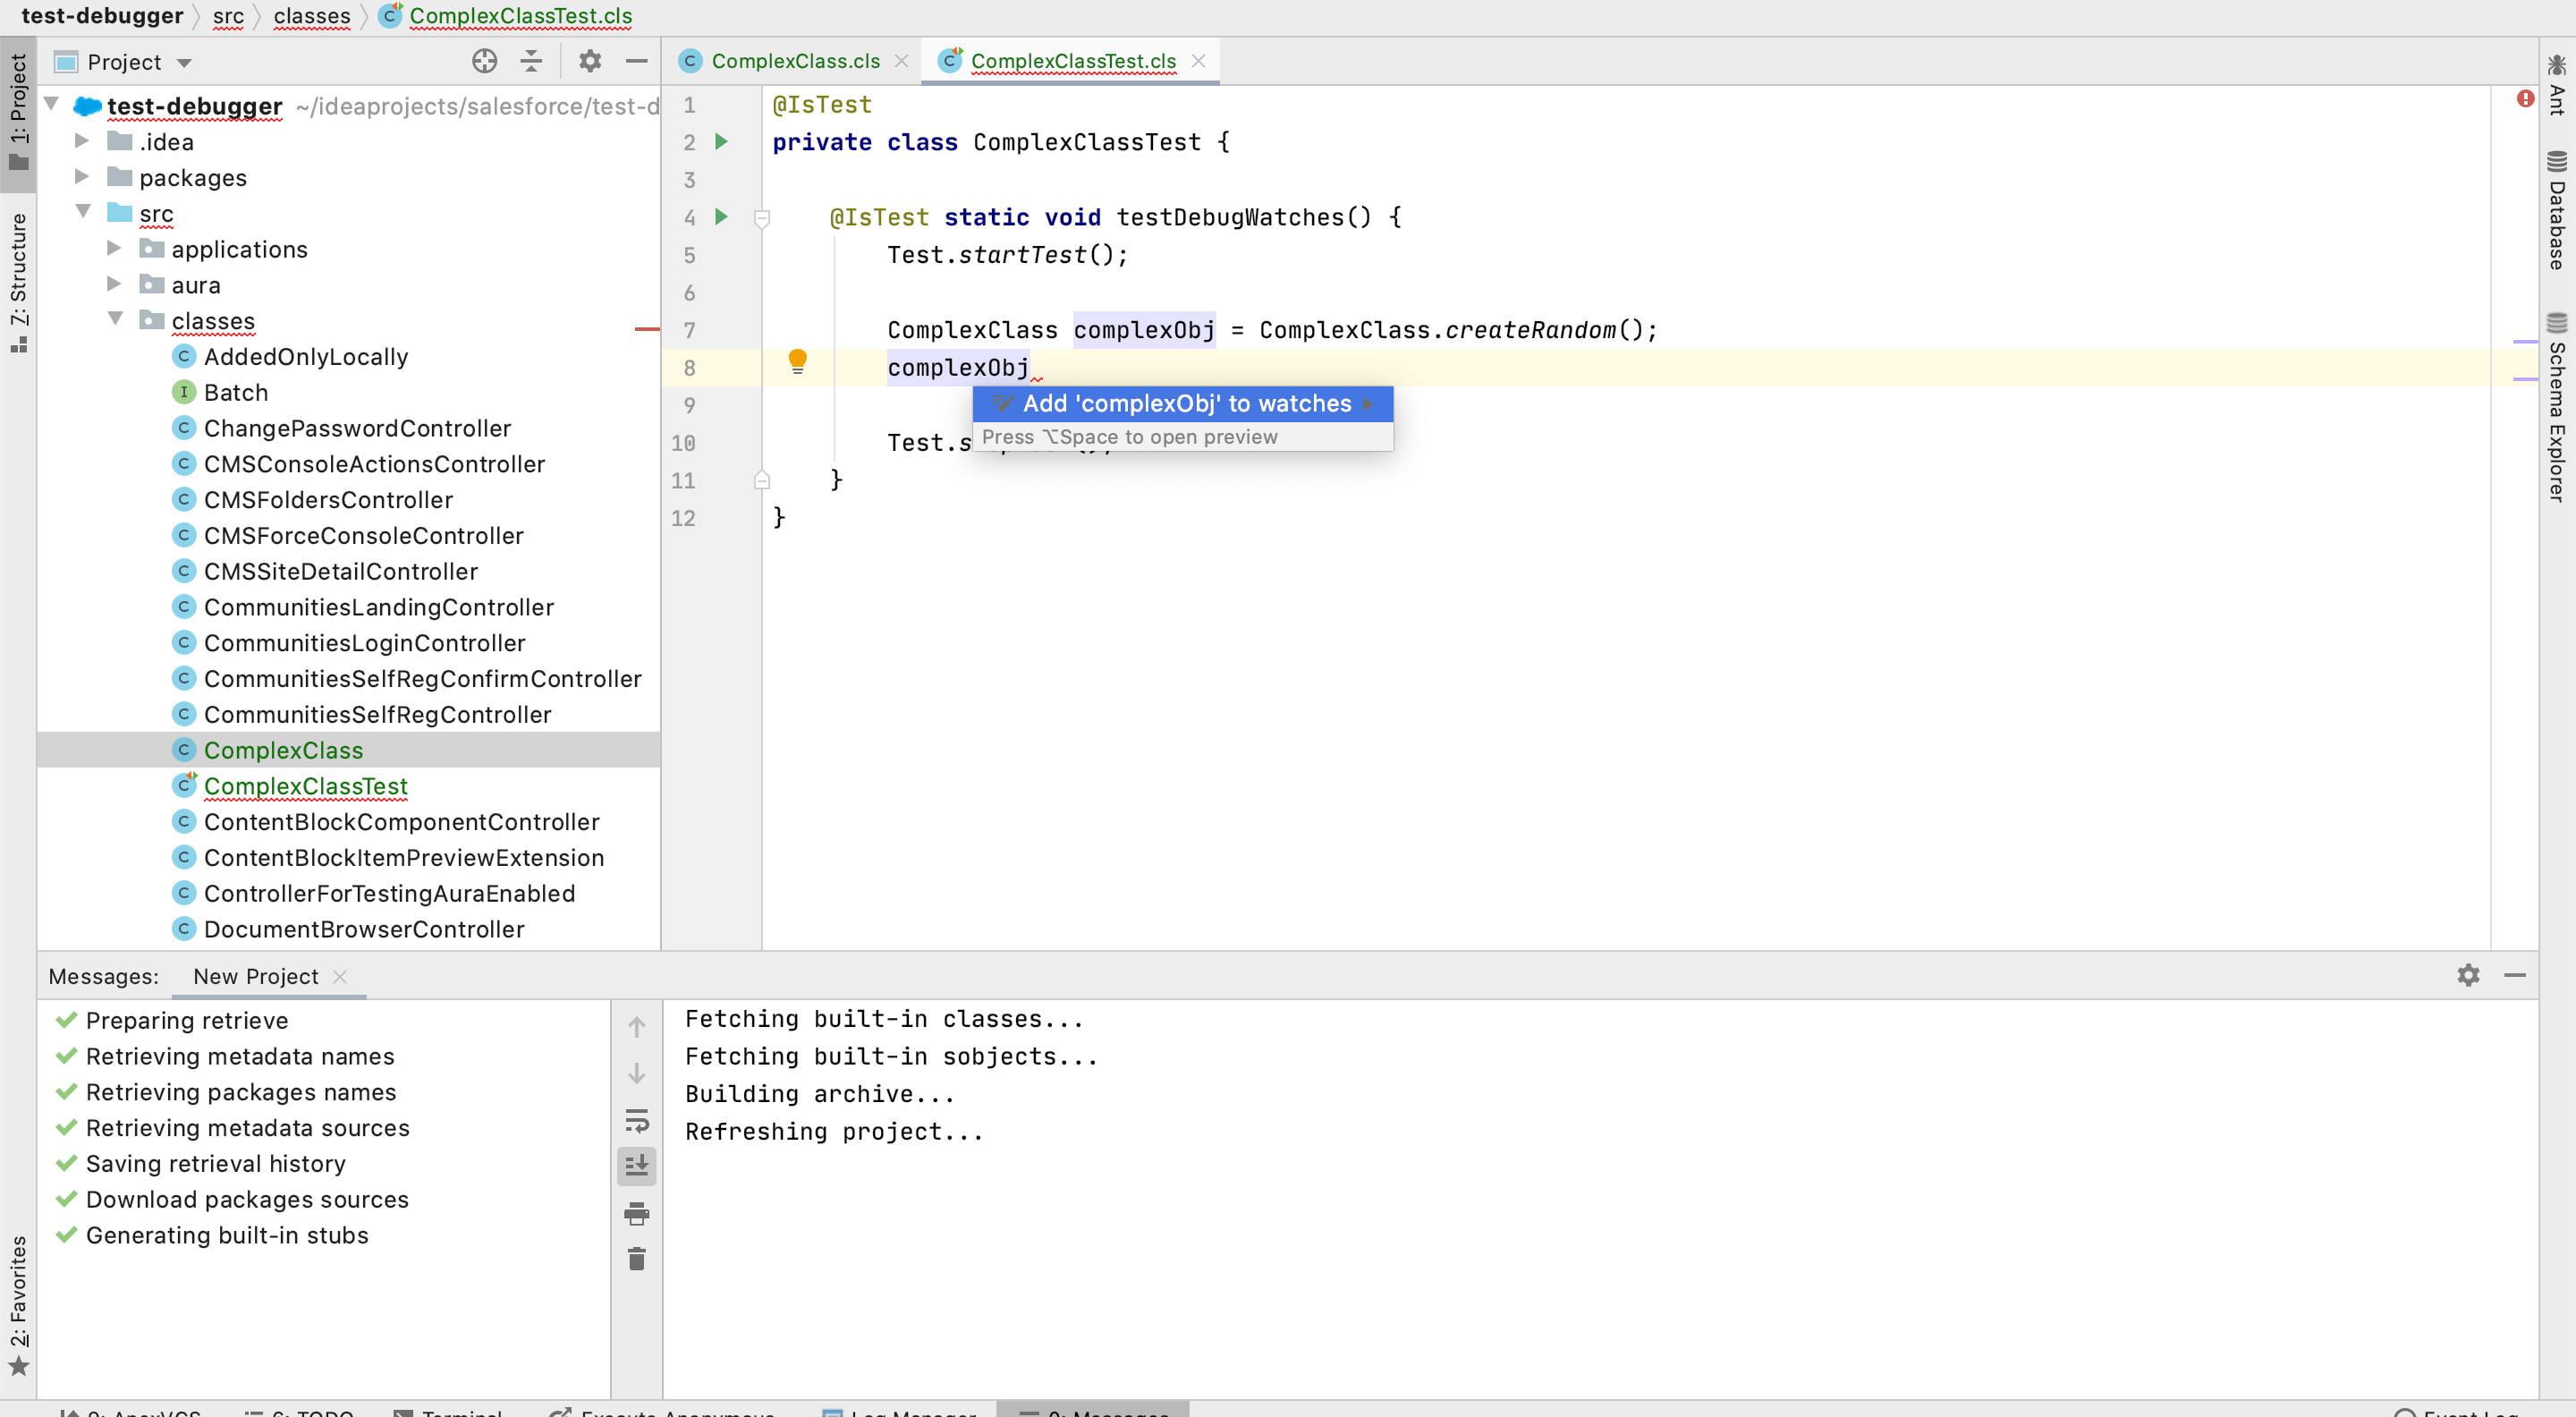
All that you need is to use "Add to Watches" intention action:

Add to Watches action in JetForcer

And explore the results:

Debug Watches in JetForcer

You can read more info about debugging here:

You must log in to answer this question.

Not the answer you're looking for? Browse other questions tagged .