In my Summer '16 organization, I have built a Lightning Component that uses Highcharts to display simple gauge chart. However, it appears that the chart rendering is done in the wrong/unexpected order, such that most labels and some additional elements are hidden.
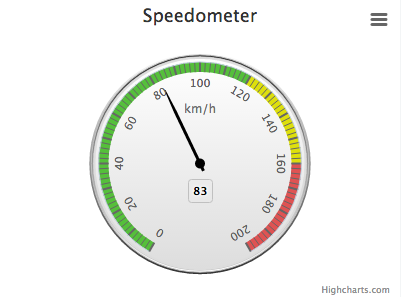
The expected display (in this case, a demonstration from the Highcharts sample site) is:
Properly ordered SVG elements:
<svg xmlns="http://www.w3.org/2000/svg" version="1.1" style="font-family:"Lucida Grande", "Lucida Sans Unicode", Arial, Helvetica, sans-serif;font-size:12px;" width="400" height="300">
<desc>Created with Highcharts 4.2.6</desc>
<defs>
<clipPath id="highcharts-1">
<rect x="0" y="0" width="380" height="239"/>
</clipPath>
<linearGradient x1="0" y1="0" x2="0" y2="1" id="highcharts-2">
<stop offset="0" stop-color="#FFF" stop-opacity="1"/>
<stop offset="1" stop-color="#333" stop-opacity="1"/>
</linearGradient>
<linearGradient x1="0" y1="0" x2="0" y2="1" id="highcharts-3">
<stop offset="0" stop-color="#333" stop-opacity="1"/>
<stop offset="1" stop-color="#FFF" stop-opacity="1"/>
</linearGradient>
<linearGradient x1="0" y1="0" x2="0" y2="1" id="highcharts-4">
<stop offset="0" stop-color="#FFF" stop-opacity="1"/>
<stop offset="1" stop-color="#DDD" stop-opacity="1"/>
</linearGradient>
</defs>
<rect x="0" y="0" width="400" height="300" fill="#FFFFFF" class=" highcharts-background"/>
<path fill="url(http://www.highcharts.com/demo/gauge-speedometer#highcharts-2)" d="M 200 54.783249999999995 A 110.71675 110.71675 0 1 1 199.88928326845274 54.783305358370384 M 200 165.5 A 0 0 0 1 0 200 165.5 "/>
<path fill="url(http://www.highcharts.com/demo/gauge-speedometer#highcharts-3)" d="M 200 56.814750000000004 A 108.68525 108.68525 0 1 1 199.89131476811414 56.81480434262048 M 200 165.5 A 0 0 0 1 0 200 165.5 " stroke="silver" stroke-width="1"/>
<path fill="url(http://www.highcharts.com/demo/gauge-speedometer#highcharts-4)" d="M 200 58.84625 A 106.65375 106.65375 0 1 1 199.89334626777557 58.846303326870554 M 200 165.5 A 0 0 0 1 0 200 165.5 " stroke="silver" stroke-width="1"/>
<path fill="#DDD" d="M 200 58.84625 A 106.65375 106.65375 0 1 1 199.89334626777557 58.846303326870554 M 199.895377767437 60.87780231112063 A 104.62225000000001 104.62225000000001 0 1 0 200 60.87774999999999 "/>
<path fill="#55BF3B" d="M 149.21249999999995 253.46653038940434 A 101.575 101.575 0 0 1 250.6995080905238 77.48272610232176 L 245.70817084311807 86.14797580920616 A 91.575 91.575 0 0 0 154.21249999999995 244.80627635155997 Z"/>
<path fill="#DDDF0D" d="M 250.7875 77.53346961059563 A 101.575 101.575 0 0 1 301.57494921250424 165.39842501692908 L 291.5749542125038 165.40842501526242 A 91.575 91.575 0 0 0 245.7875 86.19372364844003 Z"/>
<path fill="#DF5353" d="M 301.575 165.49999999999991 A 101.575 101.575 0 0 1 250.87544112198046 253.4156989146074 L 245.8667833693858 244.76044920605634 A 91.575 91.575 0 0 0 291.575 165.49999999999991 Z"/>
<g class="highcharts-grid"/>
<g class="highcharts-axis">
<path fill="none" d="M 149.21249999999995 253.46653038940434 L 154.21249999999995 244.80627635155997" stroke="#666" stroke-width="1" opacity="1"/>
<path fill="none" d="M 144.67829001834855 250.6879629390564 L 150.12468036849884 242.30125725960215" stroke="#666" stroke-width="1" opacity="1"/>
<path fill="none" d="M 140.29571299839202 247.67590120363528 L 146.17356552131676 239.5857312598858" stroke="#666" stroke-width="1" opacity="1"/>
<path fill="none" d="M 136.0767812791127 244.4386010349918 L 142.3699851896111 236.66714142042207" stroke="#666" stroke-width="1" opacity="1"/>
<path fill="none" d="M 132.03305865909897 240.98493564786628 L 138.72436472268754 233.55348739309235" stroke="#666" stroke-width="1" opacity="1"/>
<path fill="none" d="M 128.1756287009764 237.32437129902354 L 135.24669651284188 230.2533034871581" stroke="#666" stroke-width="1" opacity="1"/>
<path fill="none" d="M 124.51506435213365 233.46694134090097 L 131.94651260690762 226.7756352773124" stroke="#666" stroke-width="1" opacity="1"/>
<path fill="none" d="M 121.06139896500815 229.42321872088723 L 128.83285857957787 223.13001481038884" stroke="#666" stroke-width="1" opacity="1"/>
<path fill="none" d="M 117.82409879636471 225.20428700160795 L 125.91426874011418 219.3264344786832" stroke="#666" stroke-width="1" opacity="1"/>
<path fill="none" d="M 114.81203706094352 220.82170998165134 L 123.19874274039778 215.37531963150107" stroke="#666" stroke-width="1" opacity="1"/>
<path fill="none" d="M 112.03346961059563 216.28749999999997 L 120.69372364844001 211.28749999999997" stroke="#666" stroke-width="1" opacity="1"/>
<path fill="none" d="M 109.49601230556652 211.61408501104447 L 118.40607754745021 207.074180013649" stroke="#666" stroke-width="1" opacity="1"/>
<path fill="none" d="M 107.20662013995279 206.81427452042436 L 116.3420747163788 202.74690808966636" stroke="#666" stroke-width="1" opacity="1"/>
<path fill="none" d="M 105.17156817854672 201.90122447506386 L 114.50737244351873 198.31754497961086" stroke="#666" stroke-width="1" opacity="1"/>
<path fill="none" d="M 103.39643435731976 196.88840120363528 L 112.9069995202713 193.7982312598858" stroke="#666" stroke-width="1" opacity="1"/>
<path fill="none" d="M 101.88608419468787 191.7895445062885 L 111.54534245757856 189.2013540552633" stroke="#666" stroke-width="1" opacity="1"/>
<path fill="none" d="M 100.64465745546369 186.6186299948139 L 110.42613346280174 184.53951308663628" stroke="#666" stroke-width="1" opacity="1"/>
<path fill="none" d="M 99.67555680404888 181.38983078646143 L 109.55244021000026 179.82548613605914" stroke="#666" stroke-width="1" opacity="1"/>
<path fill="none" d="M 98.98143847796763 176.11747865641186 L 108.92665743165036 175.07219402373534" stroke="#666" stroke-width="1" opacity="1"/>
<path fill="none" d="M 98.56420500730415 170.816024755377 L 108.5505003548499 170.29266519294757" stroke="#666" stroke-width="1" opacity="1"/>
<text x="200" text-anchor="middle" transform="translate(0,0)" class=" highcharts-yaxis-title" style="color:#707070;fill:#707070;" y="114.7125">km/h</text>
<path fill="none" d="M 149.21249999999995 253.46653038940434 A 101.575 101.575 0 1 1 250.87544112198043 253.4156989146074 M 200 165.5 A 0 0 0 1 0 200 165.5 " stroke="#C0D0E0" stroke-width="1"/>
</g>
<g class="highcharts-data-labels highcharts-series-0 highcharts-tracker" visibility="visible" transform="translate(10,46) scale(1 1)" style="">
<g style="" transform="translate(178,135)">
<rect x="0.5" y="0.5" width="24" height="23" fill="none" stroke="silver" stroke-width="1" rx="3" ry="3"/>
<text x="5" style="font-size:11px;font-weight:bold;color:#000000;text-shadow:0 0 6px #FFFFFF, 0 0 3px #FFFFFF;fill:#000000;text-rendering:geometricPrecision;" y="16">
<tspan>82</tspan>
</text>
</g>
</g>
<g class="highcharts-series-group">
<g class="highcharts-series highcharts-series-0 highcharts-tracker" transform="translate(10,46) scale(1 1)" style="" clip-path="url(http://www.highcharts.com/demo/gauge-speedometer#highcharts-1)">
<path fill="black" d="M -8.126 -1.5 L 56.882000000000005 -1.5 81.26 -0.5 81.26 0.5 56.882000000000005 1.5 -8.126 1.5 z" transform="translate(190,119.5) rotate(-117 0 0)"/>
<circle cx="0" cy="0" r="5" fill="black" transform="translate(190,119.5)"/>
</g>
<g class="highcharts-markers highcharts-series-0" transform="translate(10,46) scale(1 1)" clip-path="none"/>
</g>
<g class="highcharts-button" style="cursor:default;" stroke-linecap="round" transform="translate(366,10)">
<title>Chart context menu</title>
<rect x="0.5" y="0.5" width="24" height="22" fill="white" stroke="none" stroke-width="1" rx="2" ry="2"/>
<path fill="#E0E0E0" d="M 6 6.5 L 20 6.5 M 6 11.5 L 20 11.5 M 6 16.5 L 20 16.5" stroke="#666" stroke-width="3"/>
<text x="0" style="color:black;fill:black;" y="12"/>
</g>
<text x="200" text-anchor="middle" class="highcharts-title" style="color:#333333;font-size:18px;fill:#333333;width:336px;" y="24">
<tspan>Speedometer</tspan>
</text>
<g class="highcharts-legend">
<g>
<g/>
</g>
</g>
<g class="highcharts-axis-labels highcharts-yaxis-labels">
<text x="161.71249999999998" style="color:#606060;cursor:default;font-size:11px;fill:#606060;width:122px;text-overflow:clip;" text-anchor="middle" transform="translate(0,0) rotate(-150 161.71249999999998 231.8158952947934)" y="231.8158952947934" opacity="1">
<tspan>0</tspan>
</text>
<text x="0" style="color:#606060;cursor:default;font-size:11px;fill:#606060;width:122px;text-overflow:clip;" text-anchor="middle" transform="translate(0,0) rotate(-135 0 -9999)" y="-9999">
<tspan>10</tspan>
</text>
<text x="133.6841047052066" style="color:#606060;cursor:default;font-size:11px;fill:#606060;width:122px;text-overflow:clip;" text-anchor="middle" transform="translate(0,0) rotate(-120 133.6841047052066 203.78749999999997)" y="203.78749999999997" opacity="1">
<tspan>20</tspan>
</text>
<text x="0" style="color:#606060;cursor:default;font-size:11px;fill:#606060;width:122px;text-overflow:clip;" text-anchor="middle" transform="translate(0,0) rotate(-104.99999999999999 0 -9999)" y="-9999">
<tspan>30</tspan>
</text>
</g>
<g class="highcharts-tooltip" style="cursor:default;padding:0;pointer-events:none;white-space:nowrap;" transform="translate(0,-9000000000)">
<path fill="none" d="M 3.5 0.5 L 13.5 0.5 C 16.5 0.5 16.5 0.5 16.5 3.5 L 16.5 13.5 C 16.5 16.5 16.5 16.5 13.5 16.5 L 3.5 16.5 C 0.5 16.5 0.5 16.5 0.5 13.5 L 0.5 3.5 C 0.5 0.5 0.5 0.5 3.5 0.5" isShadow="true" stroke="black" stroke-opacity="0.049999999999999996" stroke-width="5" transform="translate(1, 1)"/>
<path fill="none" d="M 3.5 0.5 L 13.5 0.5 C 16.5 0.5 16.5 0.5 16.5 3.5 L 16.5 13.5 C 16.5 16.5 16.5 16.5 13.5 16.5 L 3.5 16.5 C 0.5 16.5 0.5 16.5 0.5 13.5 L 0.5 3.5 C 0.5 0.5 0.5 0.5 3.5 0.5" isShadow="true" stroke="black" stroke-opacity="0.09999999999999999" stroke-width="3" transform="translate(1, 1)"/>
<path fill="none" d="M 3.5 0.5 L 13.5 0.5 C 16.5 0.5 16.5 0.5 16.5 3.5 L 16.5 13.5 C 16.5 16.5 16.5 16.5 13.5 16.5 L 3.5 16.5 C 0.5 16.5 0.5 16.5 0.5 13.5 L 0.5 3.5 C 0.5 0.5 0.5 0.5 3.5 0.5" isShadow="true" stroke="black" stroke-opacity="0.15" stroke-width="1" transform="translate(1, 1)"/>
<path fill="rgba(249, 249, 249, .85)" d="M 3.5 0.5 L 13.5 0.5 C 16.5 0.5 16.5 0.5 16.5 3.5 L 16.5 13.5 C 16.5 16.5 16.5 16.5 13.5 16.5 L 3.5 16.5 C 0.5 16.5 0.5 16.5 0.5 13.5 L 0.5 3.5 C 0.5 0.5 0.5 0.5 3.5 0.5"/>
<text x="8" style="font-size:12px;color:#333333;fill:#333333;" y="20"/>
</g>
<text x="390" text-anchor="end" style="cursor:pointer;color:#909090;font-size:9px;fill:#909090;" y="295">Highcharts.com</text>
</svg>
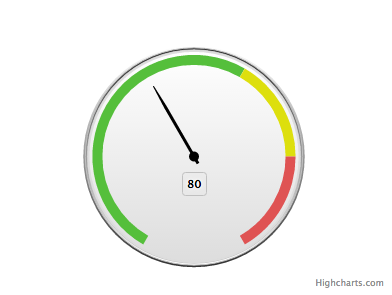
However, in the Lightning component it results in the following:
Mis-ordered SVG elements:
<svg xmlns="http://www.w3.org/2000/svg" version="1.1" style="font-family:"Lucida Grande", "Lucida Sans Unicode", Arial, Helvetica, sans-serif;font-size:12px;" width="400" height="300">
<desc>Created with Highcharts 4.2.6</desc>
<defs>
<clipPath id="highcharts-1">
<rect x="0" y="0" width="380" height="239"/>
</clipPath>
<linearGradient x1="0" y1="0" x2="0" y2="1" id="highcharts-2">
<stop offset="0" stop-color="#FFF" stop-opacity="1"/>
<stop offset="1" stop-color="#333" stop-opacity="1"/>
</linearGradient>
<linearGradient x1="0" y1="0" x2="0" y2="1" id="highcharts-3">
<stop offset="0" stop-color="#333" stop-opacity="1"/>
<stop offset="1" stop-color="#FFF" stop-opacity="1"/>
</linearGradient>
<linearGradient x1="0" y1="0" x2="0" y2="1" id="highcharts-4">
<stop offset="0" stop-color="#FFF" stop-opacity="1"/>
<stop offset="1" stop-color="#DDD" stop-opacity="1"/>
</linearGradient>
</defs>
<g class="highcharts-tooltip" style="cursor:default;padding:0;pointer-events:none;white-space:nowrap;" transform="translate(0,-9000000000)">
<path fill="none" d="M 3.5 0.5 L 13.5 0.5 C 16.5 0.5 16.5 0.5 16.5 3.5 L 16.5 13.5 C 16.5 16.5 16.5 16.5 13.5 16.5 L 3.5 16.5 C 0.5 16.5 0.5 16.5 0.5 13.5 L 0.5 3.5 C 0.5 0.5 0.5 0.5 3.5 0.5" isShadow="true" stroke="black" stroke-opacity="0.049999999999999996" stroke-width="5" transform="translate(1, 1)"/>
<path fill="none" d="M 3.5 0.5 L 13.5 0.5 C 16.5 0.5 16.5 0.5 16.5 3.5 L 16.5 13.5 C 16.5 16.5 16.5 16.5 13.5 16.5 L 3.5 16.5 C 0.5 16.5 0.5 16.5 0.5 13.5 L 0.5 3.5 C 0.5 0.5 0.5 0.5 3.5 0.5" isShadow="true" stroke="black" stroke-opacity="0.09999999999999999" stroke-width="3" transform="translate(1, 1)"/>
<path fill="none" d="M 3.5 0.5 L 13.5 0.5 C 16.5 0.5 16.5 0.5 16.5 3.5 L 16.5 13.5 C 16.5 16.5 16.5 16.5 13.5 16.5 L 3.5 16.5 C 0.5 16.5 0.5 16.5 0.5 13.5 L 0.5 3.5 C 0.5 0.5 0.5 0.5 3.5 0.5" isShadow="true" stroke="black" stroke-opacity="0.15" stroke-width="1" transform="translate(1, 1)"/>
<path fill="rgba(249, 249, 249, .85)" d="M 3.5 0.5 L 13.5 0.5 C 16.5 0.5 16.5 0.5 16.5 3.5 L 16.5 13.5 C 16.5 16.5 16.5 16.5 13.5 16.5 L 3.5 16.5 C 0.5 16.5 0.5 16.5 0.5 13.5 L 0.5 3.5 C 0.5 0.5 0.5 0.5 3.5 0.5"/>
<text x="8" style="font-size:12px;color:#333333;fill:#333333;" y="20"/>
</g>
<text x="200" text-anchor="middle" class="highcharts-title" style="color:#333333;font-size:18px;fill:#333333;width:336px;" y="24">
<tspan>Speedometer</tspan>
</text>
<g class="highcharts-legend">
<g>
<g/>
</g>
</g>
<g class="highcharts-grid"/>
<g class="highcharts-axis">
<path fill="none" d="M 149.21249999999995 253.46653038940434 L 154.21249999999995 244.80627635155997" stroke="#666" stroke-width="1" opacity="1"/>
<path fill="none" d="M 144.67829001834855 250.6879629390564 L 150.12468036849884 242.30125725960215" stroke="#666" stroke-width="1" opacity="1"/>
<path fill="none" d="M 140.29571299839202 247.67590120363528 L 146.17356552131676 239.5857312598858" stroke="#666" stroke-width="1" opacity="1"/>
<path fill="none" d="M 136.0767812791127 244.4386010349918 L 142.3699851896111 236.66714142042207" stroke="#666" stroke-width="1" opacity="1"/>
<path fill="none" d="M 132.03305865909897 240.98493564786628 L 138.72436472268754 233.55348739309235" stroke="#666" stroke-width="1" opacity="1"/>
<path fill="none" d="M 128.1756287009764 237.32437129902354 L 135.24669651284188 230.2533034871581" stroke="#666" stroke-width="1" opacity="1"/>
<path fill="none" d="M 124.51506435213365 233.46694134090097 L 131.94651260690762 226.7756352773124" stroke="#666" stroke-width="1" opacity="1"/>
<path fill="none" d="M 121.06139896500815 229.42321872088723 L 128.83285857957787 223.13001481038884" stroke="#666" stroke-width="1" opacity="1"/>
<path fill="none" d="M 117.82409879636471 225.20428700160795 L 125.91426874011418 219.3264344786832" stroke="#666" stroke-width="1" opacity="1"/>
<path fill="none" d="M 114.81203706094352 220.82170998165134 L 123.19874274039778 215.37531963150107" stroke="#666" stroke-width="1" opacity="1"/>
<path fill="none" d="M 112.03346961059563 216.28749999999997 L 120.69372364844001 211.28749999999997" stroke="#666" stroke-width="1" opacity="1"/>
<path fill="none" d="M 109.49601230556652 211.61408501104447 L 118.40607754745021 207.074180013649" stroke="#666" stroke-width="1" opacity="1"/>
<path fill="none" d="M 107.20662013995279 206.81427452042436 L 116.3420747163788 202.74690808966636" stroke="#666" stroke-width="1" opacity="1"/>
<path fill="none" d="M 105.17156817854672 201.90122447506386 L 114.50737244351873 198.31754497961086" stroke="#666" stroke-width="1" opacity="1"/>
<path fill="none" d="M 103.39643435731976 196.88840120363528 L 112.9069995202713 193.7982312598858" stroke="#666" stroke-width="1" opacity="1"/>
<path fill="none" d="M 101.88608419468787 191.7895445062885 L 111.54534245757856 189.2013540552633" stroke="#666" stroke-width="1" opacity="1"/>
<path fill="none" d="M 100.64465745546369 186.6186299948139 L 110.42613346280174 184.53951308663628" stroke="#666" stroke-width="1" opacity="1"/>
<path fill="none" d="M 99.67555680404888 181.38983078646143 L 109.55244021000026 179.82548613605914" stroke="#666" stroke-width="1" opacity="1"/>
<path fill="none" d="M 98.98143847796763 176.11747865641186 L 108.92665743165036 175.07219402373534" stroke="#666" stroke-width="1" opacity="1"/>
<path fill="none" d="M 98.56420500730415 170.816024755377 L 108.5505003548499 170.29266519294757" stroke="#666" stroke-width="1" opacity="1"/>
<path fill="none" d="M 98.425 165.5 L 108.425 165.5" stroke="#666" stroke-width="1" opacity="1"/>
<path fill="none" d="M 98.56420500730415 160.18397524462293 L 108.5505003548499 160.70733480705238" stroke="#666" stroke-width="1" opacity="1"/>
<path fill="none" d="M 149.21249999999995 253.46653038940434 A 101.575 101.575 0 1 1 250.87544112198043 253.4156989146074 M 200 165.5 A 0 0 0 1 0 200 165.5 " stroke="#C0D0E0" stroke-width="1"/>
</g>
<g class="highcharts-axis-labels highcharts-yaxis-labels">
<text x="161.71249999999998" style="color:#606060;cursor:default;font-size:11px;fill:#606060;width:122px;text-overflow:clip;" text-anchor="middle" transform="translate(0,0) rotate(-150 161.71249999999998 231.8158952947934)" y="231.8158952947934" opacity="1">
<tspan>0</tspan>
</text>
<text x="0" style="color:#606060;cursor:default;font-size:11px;fill:#606060;width:122px;text-overflow:clip;" text-anchor="middle" transform="translate(0,0) rotate(-135 0 -9999)" y="-9999">
<tspan>10</tspan>
</text>
<text x="133.6841047052066" style="color:#606060;cursor:default;font-size:11px;fill:#606060;width:122px;text-overflow:clip;" text-anchor="middle" transform="translate(0,0) rotate(-120 133.6841047052066 203.78749999999997)" y="203.78749999999997" opacity="1">
<tspan>20</tspan>
</text>
<text x="0" style="color:#606060;cursor:default;font-size:11px;fill:#606060;width:122px;text-overflow:clip;" text-anchor="middle" transform="translate(0,0) rotate(-104.99999999999999 0 -9999)" y="-9999">
<tspan>30</tspan>
</text>
</g>
<rect x="0" y="0" width="400" height="300" fill="#FFFFFF" class=" highcharts-background"/>
<path fill="url(#highcharts-2)" d="M 200 54.783249999999995 A 110.71675 110.71675 0 1 1 199.88928326845274 54.783305358370384 M 200 165.5 A 0 0 0 1 0 200 165.5 "/>
<path fill="url(#highcharts-3)" d="M 200 56.814750000000004 A 108.68525 108.68525 0 1 1 199.89131476811414 56.81480434262048 M 200 165.5 A 0 0 0 1 0 200 165.5 " stroke="silver" stroke-width="1"/>
<path fill="url(#highcharts-4)" d="M 200 58.84625 A 106.65375 106.65375 0 1 1 199.89334626777557 58.846303326870554 M 200 165.5 A 0 0 0 1 0 200 165.5 " stroke="silver" stroke-width="1"/>
<path fill="#DDD" d="M 200 58.84625 A 106.65375 106.65375 0 1 1 199.89334626777557 58.846303326870554 M 199.895377767437 60.87780231112063 A 104.62225000000001 104.62225000000001 0 1 0 200 60.87774999999999 "/>
<path fill="#55BF3B" d="M 149.21249999999995 253.46653038940434 A 101.575 101.575 0 0 1 250.6995080905238 77.48272610232176 L 245.70817084311807 86.14797580920616 A 91.575 91.575 0 0 0 154.21249999999995 244.80627635155997 Z"/>
<path fill="#DDDF0D" d="M 250.7875 77.53346961059563 A 101.575 101.575 0 0 1 301.57494921250424 165.39842501692908 L 291.5749542125038 165.40842501526242 A 91.575 91.575 0 0 0 245.7875 86.19372364844003 Z"/>
<path fill="#DF5353" d="M 301.575 165.49999999999991 A 101.575 101.575 0 0 1 250.87544112198046 253.4156989146074 L 245.8667833693858 244.76044920605634 A 91.575 91.575 0 0 0 291.575 165.49999999999991 Z"/>
<g class="highcharts-series-group">
<g class="highcharts-series highcharts-series-0 highcharts-tracker" transform="translate(10,46) scale(1 1)" style="" clip-path="url(#highcharts-1)">
<path fill="black" d="M -8.126 -1.5 L 56.882000000000005 -1.5 81.26 -0.5 81.26 0.5 56.882000000000005 1.5 -8.126 1.5 z" transform="translate(190,119.5) rotate(-120.00000000000001 0 0)"/>
<circle cx="0" cy="0" r="5" fill="black" transform="translate(190,119.5)"/>
</g>
<g class="highcharts-markers highcharts-series-0" transform="translate(10,46) scale(1 1)" clip-path="none"/>
</g>
<g class="highcharts-data-labels highcharts-series-0 highcharts-tracker" visibility="visible" transform="translate(10,46) scale(1 1)" style="">
<g style="" transform="translate(178,135)">
<rect x="0.5" y="0.5" width="24" height="23" fill="none" stroke="silver" stroke-width="1" rx="3" ry="3"/>
<text x="5" style="font-size:11px;font-weight:bold;color:#000000;text-shadow:0 0 6px #FFFFFF, 0 0 3px #FFFFFF;fill:#000000;text-rendering:geometricPrecision;" y="16">
<tspan>80</tspan>
</text>
</g>
</g>
<text x="390" text-anchor="end" style="cursor:pointer;color:#909090;font-size:9px;fill:#909090;" y="295">Highcharts.com</text>
</svg>
As you can see, the Lightning framework with LockerService enabled appears to cause the SVG elements to be mis-ordered. No errors or warnings are shown in the log, only the result is wrong.
Does anyone know of a way to resolve this, short of disabling the LockerService?
An unmanaged package with source code to reproduce is included in the comments below.


