1

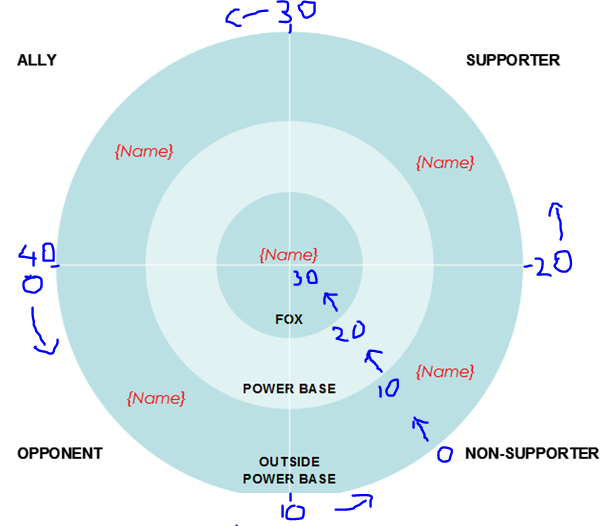
I want to create a chart map in lightning something like this

enter image description here

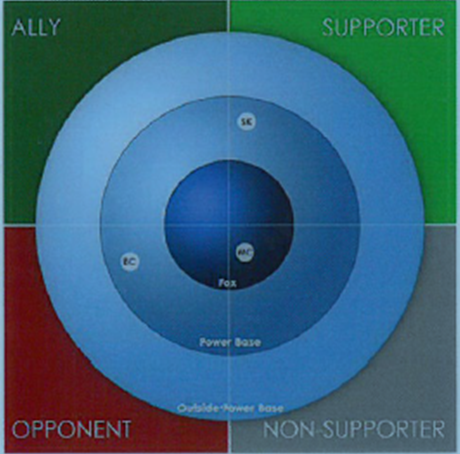
where the names are marked on a point on the base map based on 2 scores.

enter image description here

I don't see any option to create as such using scatter chart or radar chart available in chart.js Is there some other way ?

1 Answer 1

5

You can write your own chart without (too) much effort yourself. All you need to do is write your own custom renderer and write your own logic. Here's a super-basic example where I draw a black circle on the screen:

Application

<aura:application >
    <canvas aura:id="chart" />
</aura:application>

Renderer

({
    // Your renderer method overrides go here
    afterRender: function(component, helper) {
        var canvas = component.find("chart").getElement();
        var context = canvas.getContext("2d");
        context.fillStyle="black";
        context.arc(50, 50, 50, 0, 2*Math.PI);
        context.fill();
    }
})

You can also do that with SVG as well, as demonstrated in the SVG helper. While the helper itself is deprecated, it does outline how to manipulate an SVG. I personally prefer using a canvas, because doesn't involve creating a bunch of elements.

2
  • Warning: if you are building an ISV, do not use SLDS SVG helper , or take inspiration from it, because it is flagged deprecated ... and is rejected by Security Review ( true story :/ ) Commented Jul 23, 2017 at 22:51
  • @NicolasVuillamy We're allowed to use SVGs, just not the SVG helper. There's no direct support for SVG without using a custom renderer yet.
    – sfdcfox
    Commented Jul 23, 2017 at 22:59

You must log in to answer this question.

Not the answer you're looking for? Browse other questions tagged .