1

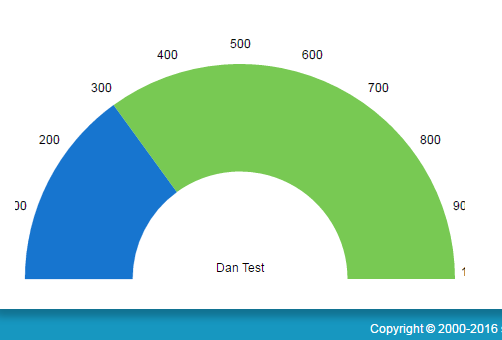
Is there a way to make the step values of a gauge show up on the inside of the gauge chart compared to the outside? I tried using apex:chartLabel and changing the display value but that does not seem to be it.

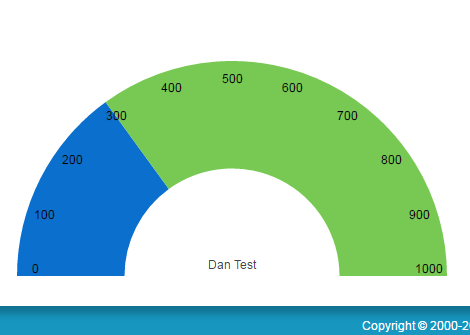
Example standard controller chart: values inside
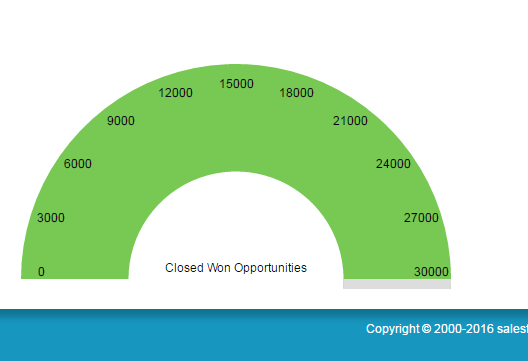
Example custom controller chart values outside

I feel like if the values were on the inside then I would not have the clipping issue of the value.

Thoughts?

<apex:page controller="ISOGaugeController2b">
<script>
MyChart1.on('beforeconfig', function(config) {
    config.axes[0].margin=-10;
});
</script>
<apex:chart height="300" width="450" animate="true" data="{!data}">
<apex:axis type="Gauge" position="gauge" title="Dan Test"
    minimum="0" maximum="1000" steps="10">
    <apex:chartLabel display="insideStart"/>
</apex:axis>         
<apex:gaugeSeries dataField="size" donut="50">
</apex:gaugeSeries>
</apex:chart>
</apex:page>
5
  • What values did you try for display? Do insideStart / insideEnd not work for you?
    – Adrian Larson
    Commented May 5, 2016 at 16:22
  • I tried all of them, I just retried display=insideStart wihin apex:axis and then within the apex:gaugeSeries and there was no affect on the values displayed. They are still above the chart. Commented May 5, 2016 at 17:05
  • It would be helpful if you edit your post to include your markup.
    – Adrian Larson
    Commented May 5, 2016 at 17:05
  • Did you also try setting the position to bottom (or any other value) on your apex:axis?
    – Adrian Larson
    Commented May 5, 2016 at 17:12
  • I just tried, seemed to have no effect. Commented May 5, 2016 at 17:25

1 Answer 1

1

Figured it out, you need to change the margin value in the apex:axis.

Example:

<apex:page controller="ISOGaugeController2b">
<script>
MyChart1.on('beforeconfig', function(config) {
    config.axes[0].margin=-10;
});
</script>
<apex:chart height="300" width="450" animate="true" data="{!data}">
<apex:axis type="Gauge" position="top" title="Dan Test"
    minimum="0" maximum="1000" steps="10" margin="-9"/>          
<apex:gaugeSeries dataField="size" donut="50"/>
</apex:chart>
</apex:page>

Shows up like this:

Steps Inside

4
  • Can you clarify if it is the attribute value or script value that makes the difference?
    – Adrian Larson
    Commented May 5, 2016 at 17:57
  • It's the attribute value. I believe the script value is moving the chart up and down within the frame, however, I can't seem to find any information on why people put that in. It's in a lot of the example gauges that I find on stack exchange, Commented May 5, 2016 at 18:14
  • Hmm, I would try removing it just to see if it has any effect. Still, nice find.
    – Adrian Larson
    Commented May 5, 2016 at 18:14
  • @AdrianLarson I can confirm that just the attribute is enough.
    – ipavlic
    Commented Dec 7, 2016 at 15:53

You must log in to answer this question.

Not the answer you're looking for? Browse other questions tagged .