Added note that I participate in developing the mentioned plugin.
Source Link

You can try to use the JetForcer plugin for Salesforce development in JetBrains IDEs (I participate in developing it). 

It provides the ability to explore complex objects during debugging.

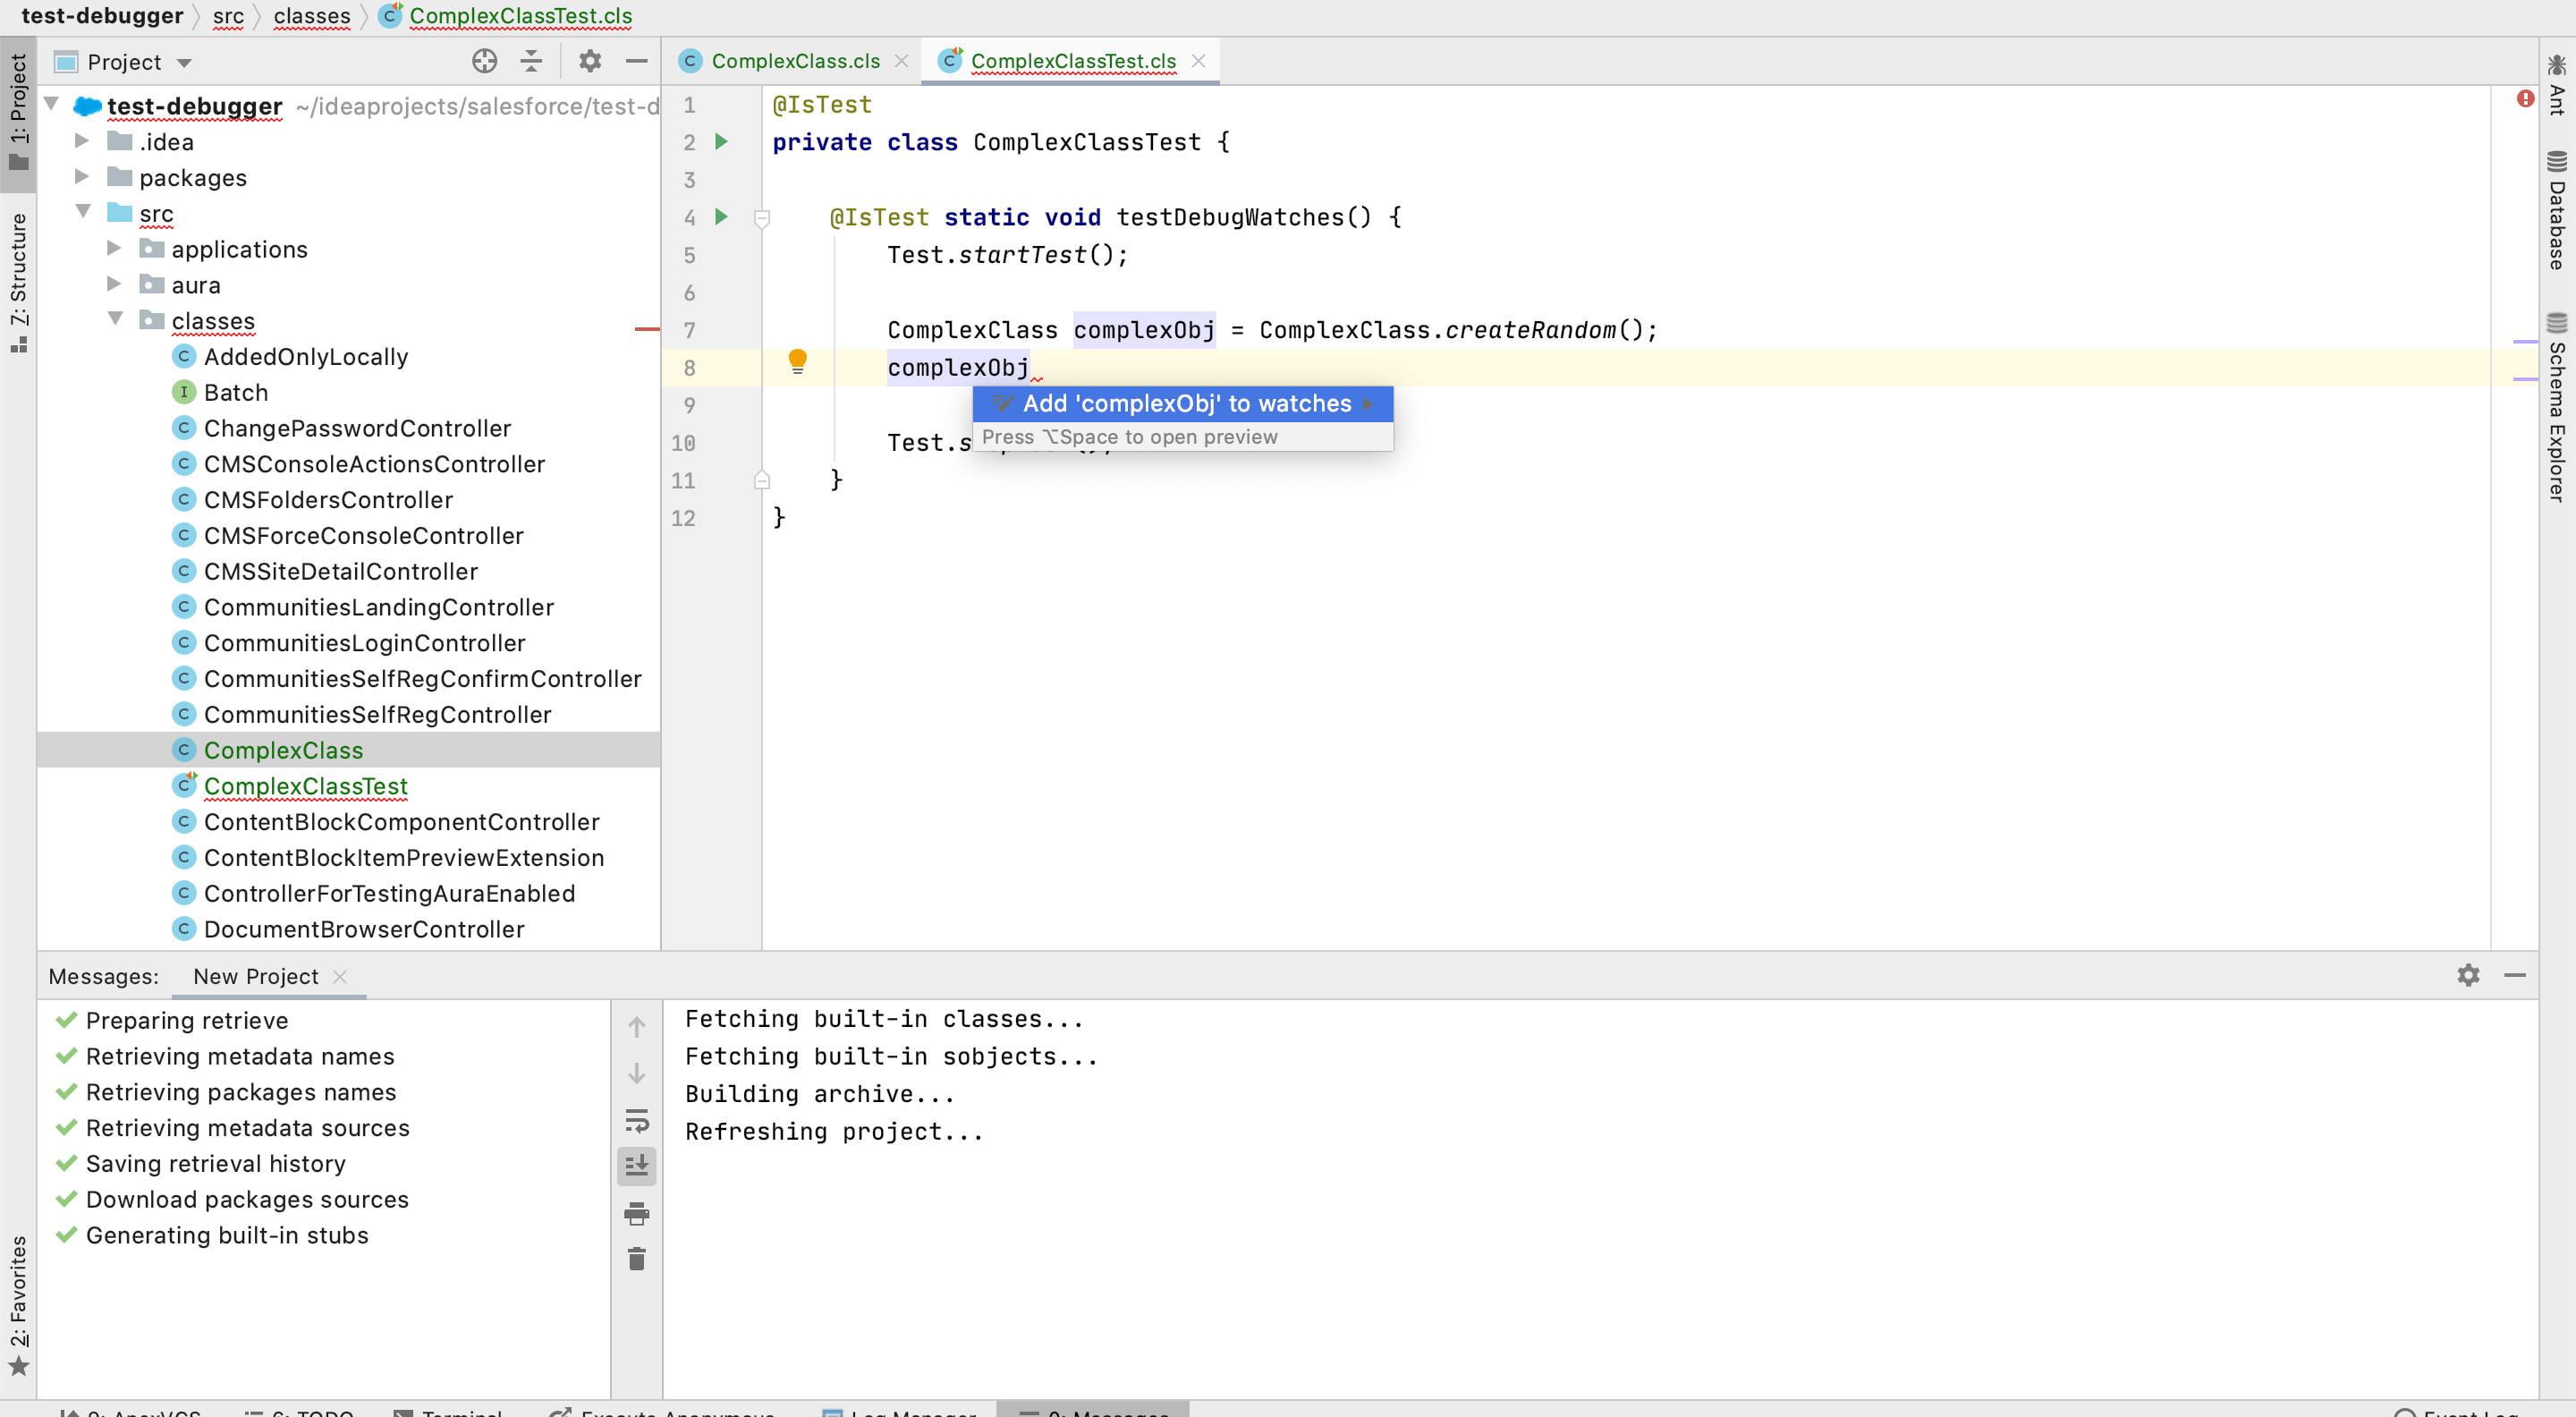
All that you need is to use "Add to Watches" intention action:

Add to Watches action in JetForcer

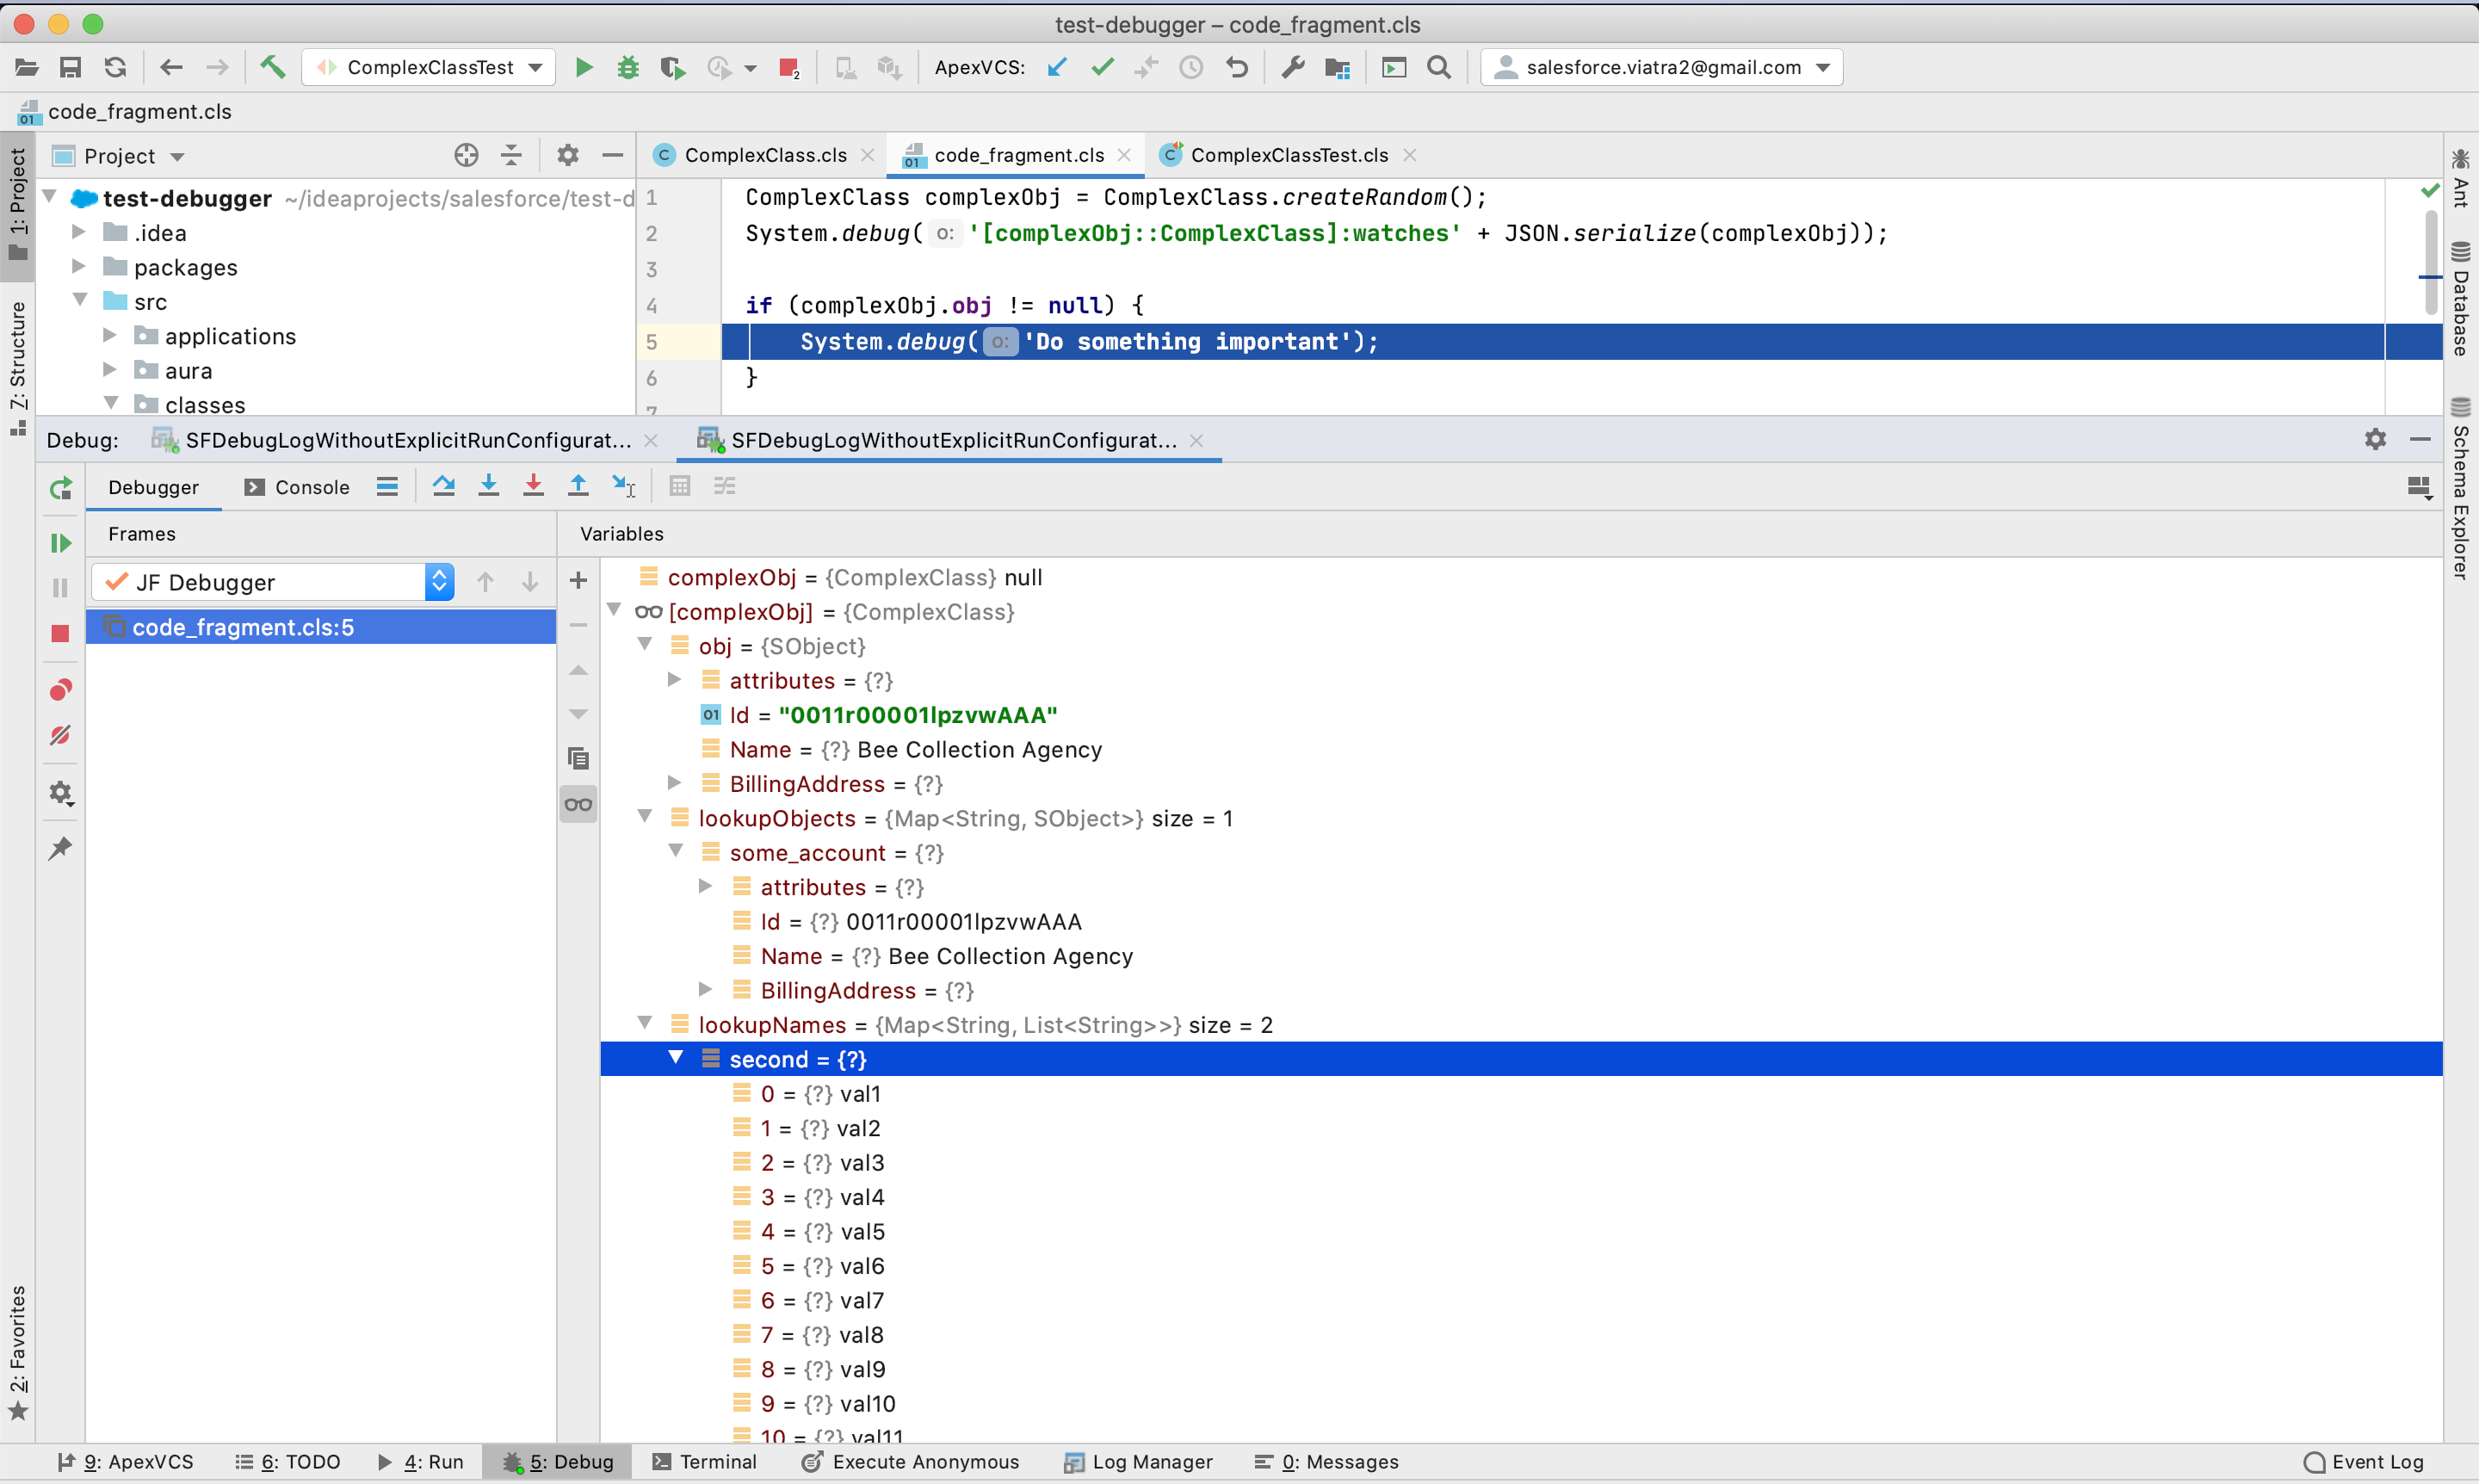
And explore the results:

Debug Watches in JetForcer

You can read more info about debugging here:

You can try to use the JetForcer plugin for Salesforce development in JetBrains IDEs. It provides the ability to explore complex objects during debugging.

All that you need is to use "Add to Watches" intention action:

Add to Watches action in JetForcer

And explore the results:

Debug Watches in JetForcer

You can read more info about debugging here:
You can try to use the JetForcer plugin for Salesforce development in JetBrains IDEs (I participate in developing it). 

It provides the ability to explore complex objects during debugging.

All that you need is to use "Add to Watches" intention action:

Add to Watches action in JetForcer

And explore the results:

Debug Watches in JetForcer

You can read more info about debugging here:
Source Link

You can try to use the JetForcer plugin for Salesforce development in JetBrains IDEs. It provides the ability to explore complex objects during debugging.

All that you need is to use "Add to Watches" intention action:

Add to Watches action in JetForcer

And explore the results:

Debug Watches in JetForcer

You can read more info about debugging here: