code updated
Source Link
ACP
  • 125
  • 3
  • 19
"listselector_1": {
                "parameters": {
                    "compact": false,
                    "displayTemplate": "[SnapshotDateText]",
                    "exploreLink": false,
                    "instant": true,
                    "measureField": "count",
                    "step": "SnapshotDateText_3",
                    "title": "SnapshotDateText"
                },
                "type": "listselector"
            },


"SnapshotDateText_3": {
                "broadcastFacet": true,
                "datasets": [
                    {
                        "id": "0Fb1r000000L5WCCA0",
                        "label": "SnapshotAnalysisDataset",
                        "name": "SnapshotAnalysisDataset",
                        "namespace": "CPRM_EA",
                        "url": "/services/data/v43.0/wave/datasets/0Fb1r000000L5WCCA0"
                    }
                ],
                "isGlobal": false,
                "query": {
                    "measures": [
                        [
                            "count",
                            "*"
                        ]
                    ],
                    "groups": [
                        "SnapshotDateText"
                    ]
                },
                "receiveFacet": false,
                "selectMode": "single",
                "type": "aggregateflex",
                "useGlobal": true,
                "visualizationParameters": {
                    "options": {}
                }
            },


"columns": [
                        {
                            "query": {
                                "measures": [
                                    [
                                        "sum",
                                        “Revenue”
                                    ]
                                ],
                                "filters": [
                                    [
        "Date1"                                "SnapshotDateText",
                                        [
                                            "{{row(listselector_1SnapshotDateText_3.selection, [0], [\"Date1\"][\"SnapshotDateText\"]).asStringasObject()}}"
                                        ],
                                        "in"
                                    ]
                                ]
                            },
                            "header": "Revenue Sum Snapshot #1"
                        },
"filters": [
    [
        "Date1",
        [
            "{{row(listselector_1.selection, [0], [\"Date1\"]).asString()}}"
        ],
        "in"
     ]
]
"listselector_1": {
                "parameters": {
                    "compact": false,
                    "displayTemplate": "[SnapshotDateText]",
                    "exploreLink": false,
                    "instant": true,
                    "measureField": "count",
                    "step": "SnapshotDateText_3",
                    "title": "SnapshotDateText"
                },
                "type": "listselector"
            },


"SnapshotDateText_3": {
                "broadcastFacet": true,
                "datasets": [
                    {
                        "id": "0Fb1r000000L5WCCA0",
                        "label": "SnapshotAnalysisDataset",
                        "name": "SnapshotAnalysisDataset",
                        "namespace": "CPRM_EA",
                        "url": "/services/data/v43.0/wave/datasets/0Fb1r000000L5WCCA0"
                    }
                ],
                "isGlobal": false,
                "query": {
                    "measures": [
                        [
                            "count",
                            "*"
                        ]
                    ],
                    "groups": [
                        "SnapshotDateText"
                    ]
                },
                "receiveFacet": false,
                "selectMode": "single",
                "type": "aggregateflex",
                "useGlobal": true,
                "visualizationParameters": {
                    "options": {}
                }
            },


"columns": [
                        {
                            "query": {
                                "measures": [
                                    [
                                        "sum",
                                        “Revenue”
                                    ]
                                ],
                                "filters": [
                                    [
                                        "SnapshotDateText",
                                        [
                                            "{{row(SnapshotDateText_3.selection, [0], [\"SnapshotDateText\"]).asObject()}}"
                                        ],
                                        "in"
                                    ]
                                ]
                            },
                            "header": "Revenue Sum Snapshot #1"
                        },
restructured the styling
Source Link
ACP
  • 125
  • 3
  • 19

Description:

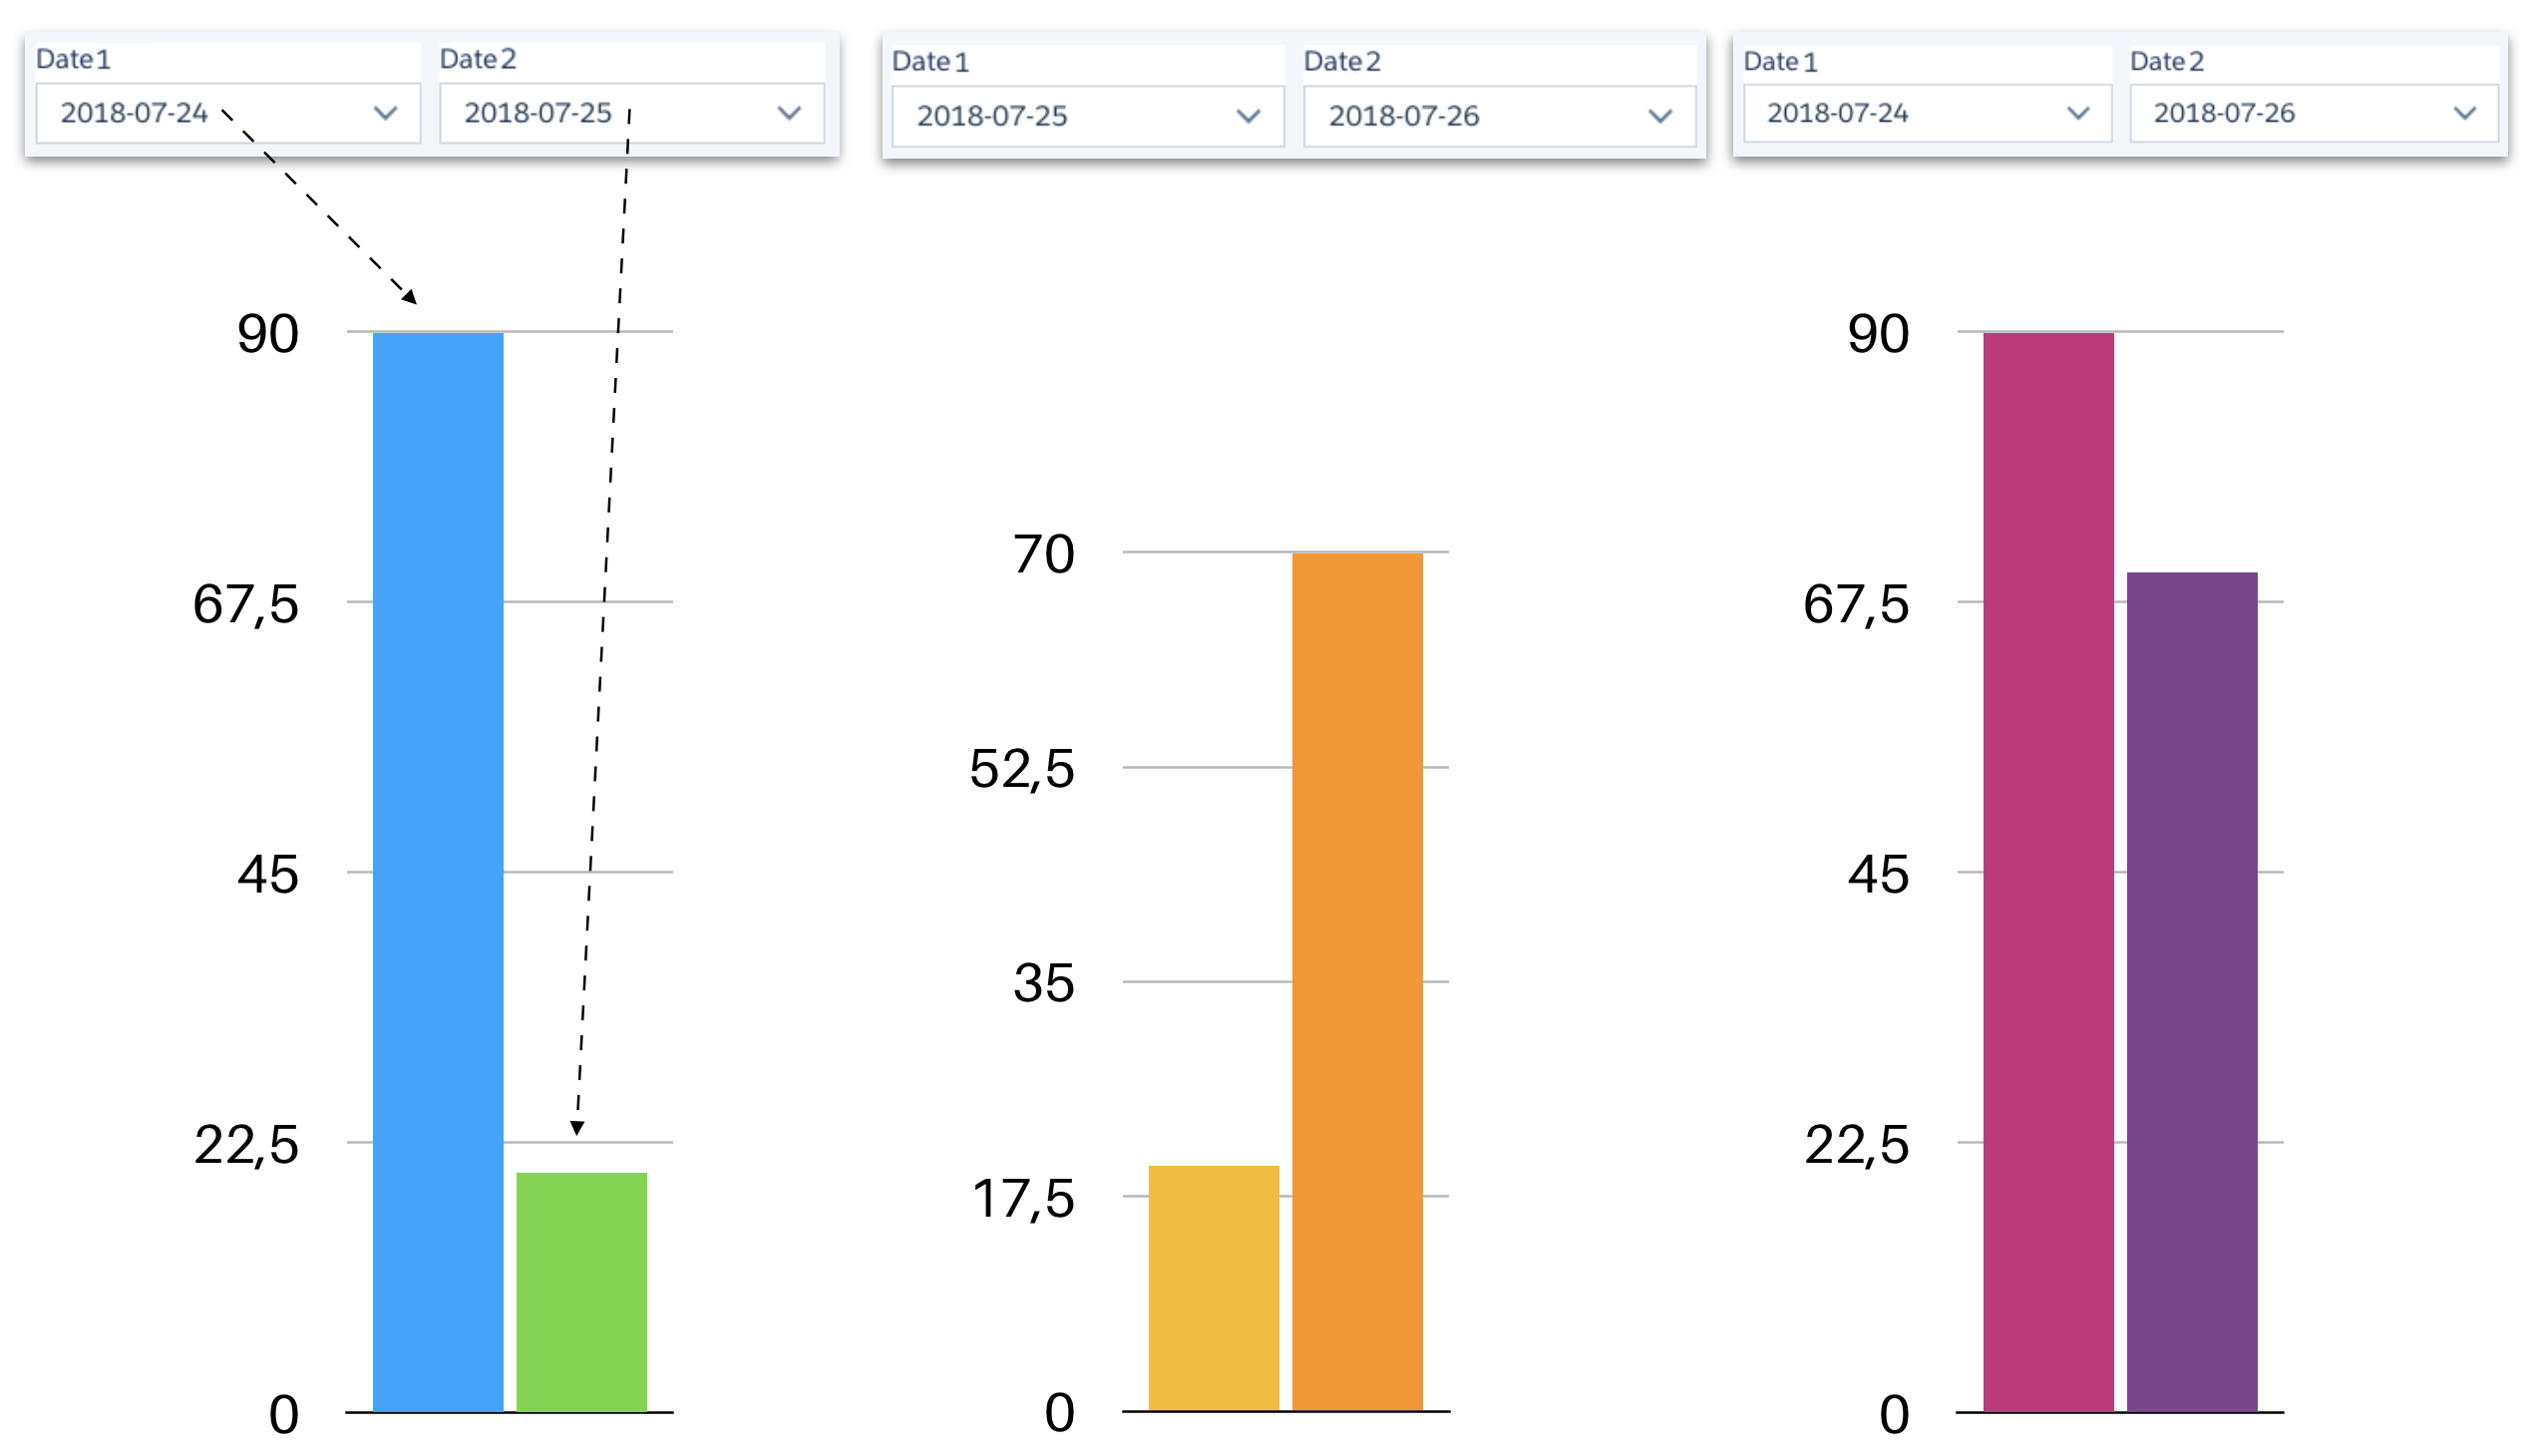
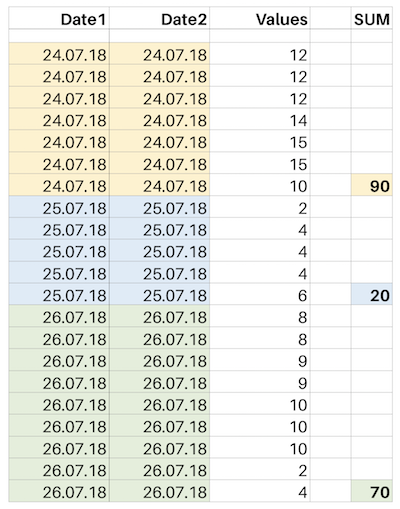
We are using Einstein Analytics to compare two different dates which share the same values in the same dataset. See the dataset sample image below.

![![Sample Dataset

The dates are string fields and in the Einstein Analytics dashboard we use two list selector elements to pick the related date.

![List selectors

Problem:

We want the chart to behave like in the image below, whenever we select 'Date1' and 'Date2' it should filter the related values and just update the bar it's bound with, in this case Date1 refers to first Bar on the chart, Date2 to second Bar.

![Chart display after selections

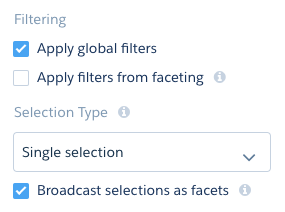
In order to make it possible, we use the compare table and removed the faceting just like Carl Brundage explains in his blog post.

Uncheck Faceting

We are making the binding as below, same for Date2.

"filters": [
    [
        "Date1",
        [
            "{{row(listselector_1.selection, [0], [\"Date1\"]).asString()}}"
        ],
        "in"
     ]
]

Question:

When we select the dates from the list selectors on the dashboard 🙈the bars don't update. When we edit the dashboard and add filters with the specific dates to filter the data, it works as expected. What's wrong in our approach, is the binding code miss something? Any ideas for a solution?

Sample Dataset: ![![Sample Dataset

Description:

We are using Einstein Analytics to compare two different dates which share the same values in the same dataset. See the dataset sample image below.

![![Sample Dataset

The dates are string fields and in the Einstein Analytics dashboard we use two list selector elements to pick the related date.

![List selectors

Problem:

We want the chart to behave like in the image below, whenever we select 'Date1' and 'Date2' it should filter the related values and just update the bar it's bound with, in this case Date1 refers to first Bar on the chart, Date2 to second Bar.

![Chart display after selections

In order to make it possible, we use the compare table and removed the faceting just like Carl Brundage explains in his blog post.

Uncheck Faceting

We are making the binding as below, same for Date2.

"filters": [
    [
        "Date1",
        [
            "{{row(listselector_1.selection, [0], [\"Date1\"]).asString()}}"
        ],
        "in"
     ]
]

Question:

When we select the dates from the list selectors on the dashboard 🙈the bars don't update. When we edit the dashboard and add filters with the specific dates to filter the data, it works as expected. What's wrong in our approach, is the binding code miss something? Any ideas for a solution?

Description:

We are using Einstein Analytics to compare two different dates which share the same values in the same dataset. See the dataset sample image below. The dates are string fields and in the Einstein Analytics dashboard we use two list selector elements to pick the related date.

Problem:

We want the chart to behave like in the image below, whenever we select 'Date1' and 'Date2' it should filter the related values and just update the bar it's bound with, in this case Date1 refers to first Bar on the chart, Date2 to second Bar.

![Chart display after selections

In order to make it possible, we use the compare table and removed the faceting just like Carl Brundage explains in his blog post.

We are making the binding as below, same for Date2.

"filters": [
    [
        "Date1",
        [
            "{{row(listselector_1.selection, [0], [\"Date1\"]).asString()}}"
        ],
        "in"
     ]
]

Question:

When we select the dates from the list selectors on the dashboard 🙈the bars don't update. When we edit the dashboard and add filters with the specific dates to filter the data, it works as expected. What's wrong in our approach, is the binding code miss something? Any ideas for a solution?

Sample Dataset: ![![Sample Dataset

inline subtitle edited
Source Link
ACP
  • 125
  • 3
  • 19

Description:

We are using Einstein Analytics to compare two different dates which share the same values in the same dataset. See the dataset sample image below.

![![Sample Dataset

The dates are string fields and in the Einstein Analytics dashboard we use two list selector elements to pick the related date.

![List selectors

Problem:

We want the chart to behave like in the image below, whenever we select 'Date1' and 'Date2' it should filter the related values and just update the bar it's bound with, in this case Date1 refers to first Bar on the chart, Date2 to second Bar.

![Chart display after selections

In order to make it possible, we use the compare table and removed the faceting just like Carl Brundage explains in his blog post.

Uncheck Faceting

We are making the binding as below, same for Date2.

"filters": [
    [
        "Date1",
        [
            "{{row(listselector_1.selection, [0], [\"Date1\"]).asString()}}"
        ],
        "in"
     ]
]

ProblemQuestion: When

When we select the dates from the list selectors on the dashboard 🙈the bars don't update. When we edit the dashboard and add filters with the specific dates to filter the data, it works as expected. What's wrong in our approach, is the binding code miss something? Any ideas for a solution?

Description:

We are using Einstein Analytics to compare two different dates which share the same values in the same dataset. See the dataset sample image below.

![![Sample Dataset

The dates are string fields and in the Einstein Analytics dashboard we use two list selector elements to pick the related date.

![List selectors

Problem:

We want the chart to behave like in the image below, whenever we select 'Date1' and 'Date2' it should filter the related values and just update the bar it's bound with, in this case Date1 refers to first Bar on the chart, Date2 to second Bar.

![Chart display after selections

In order to make it possible, we use the compare table and removed the faceting just like Carl Brundage explains in his blog post.

Uncheck Faceting

We are making the binding as below, same for Date2.

"filters": [
    [
        "Date1",
        [
            "{{row(listselector_1.selection, [0], [\"Date1\"]).asString()}}"
        ],
        "in"
     ]
]

Problem: When we select the dates from the list selectors on the dashboard 🙈the bars don't update. When we edit the dashboard and add filters with the specific dates to filter the data, it works as expected. What's wrong in our approach, is the binding code miss something? Any ideas for a solution?

Description:

We are using Einstein Analytics to compare two different dates which share the same values in the same dataset. See the dataset sample image below.

![![Sample Dataset

The dates are string fields and in the Einstein Analytics dashboard we use two list selector elements to pick the related date.

![List selectors

Problem:

We want the chart to behave like in the image below, whenever we select 'Date1' and 'Date2' it should filter the related values and just update the bar it's bound with, in this case Date1 refers to first Bar on the chart, Date2 to second Bar.

![Chart display after selections

In order to make it possible, we use the compare table and removed the faceting just like Carl Brundage explains in his blog post.

Uncheck Faceting

We are making the binding as below, same for Date2.

"filters": [
    [
        "Date1",
        [
            "{{row(listselector_1.selection, [0], [\"Date1\"]).asString()}}"
        ],
        "in"
     ]
]

Question:

When we select the dates from the list selectors on the dashboard 🙈the bars don't update. When we edit the dashboard and add filters with the specific dates to filter the data, it works as expected. What's wrong in our approach, is the binding code miss something? Any ideas for a solution?

Source Link
ACP
  • 125
  • 3
  • 19
Loading